Action Research is a collaborative, problem-solving approach where the people who live the problem (teachers, nurses, residents, employees, etc.) co-design, test, and refine solutions with the process carefully documented so it also produces credible knowledge.
🔎 What Action Research Really Is
At its heart, Action Research (AR) is a way of solving problems together while also learning from the process.
Unlike traditional research (where scientists study people from the outside), in AR:
- The people living the problem help decide what to try.
- Everyone works as partners — not as “researcher vs subject.”
- The goal is twofold:
- Immediate improvement (make life better right now).
- Lasting knowledge (so others can learn from what happened).
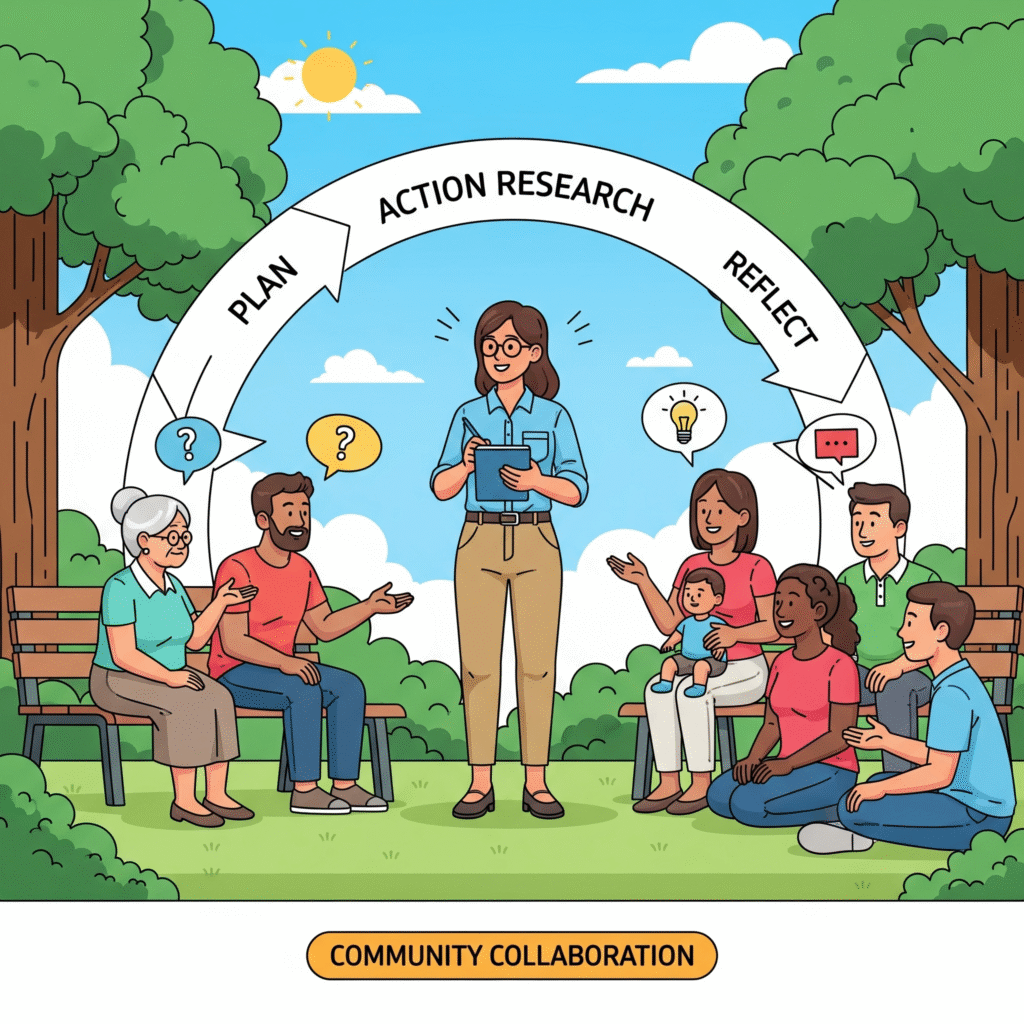
🌀 The Core Loop: Learn by Doing
AR is not a one-time experiment. It’s a repeating cycle:
Plan → Act → Observe → Reflect → Adjust → Repeat
Here’s how each step works:
- Plan
- Together, decide on a small, realistic change to test.
- Example: “Let’s try a 2-minute huddle at the start of every hospital shift.”
- Act
- Put the plan into action for a short period (2–6 weeks).
- Observe
- Collect simple evidence of what happened.
- Numbers (missed breaks ↓ from 50% to 30%) + stories (“The huddle makes me feel supported”).
- Reflect
- Meet and discuss:
- What worked?
- What didn’t?
- What surprised us?
- Meet and discuss:
- Adjust
- Decide: keep, tweak, or drop the change.
- Example: “Keep the huddles, but assign a rotating leader.”
- Repeat
- Try again, with adjustments. Each cycle builds stronger solutions.
🏫 Simple, Everyday Example
Context: A teacher notices that in class, only a few students speak while others stay silent.
- Plan: Teacher + students agree to test a “Talk Token” system (each student gets 3 tokens to spend when speaking).
- Act: They try it for 2 weeks.
- Observe: Participation rises from 30% → 65%. Students say, “I finally got a chance to talk.”
- Reflect: Teacher sees it works but needs clearer rules to stop long speeches.
- Adjust: Next round, tokens limit both frequency and length of comments.
- Repeat: Run it again.
By the end, the class is more balanced and inclusive, and the teacher has evidence to share with other teachers.
🏥 Healthcare Example
Context: Nurses are stressed because they miss breaks.
- Plan: Test a 2-minute “compassion huddle” at the start of shifts.
- Act: Run for 4 weeks.
- Observe: Missed breaks drop 20%; nurses say, “The huddle reminds me I’m not alone.”
- Reflect: Works well, but night shifts skip it without a leader.
- Adjust: Add a rotating “Huddle Host.”
- Repeat: Try again.
Nurses feel better, and management learns a low-cost, high-impact practice that can spread hospital-wide.
🌍 Why AR is Powerful
- It improves life now (not just after a long study).
- It respects people’s voices (they’re co-creators).
- It creates knowledge others can use (your story becomes a guide for another school, ward, or city).
- It works in cycles — you don’t have to “get it right” on the first try.
Action Research = solving problems together, step by step, while learning from the process.
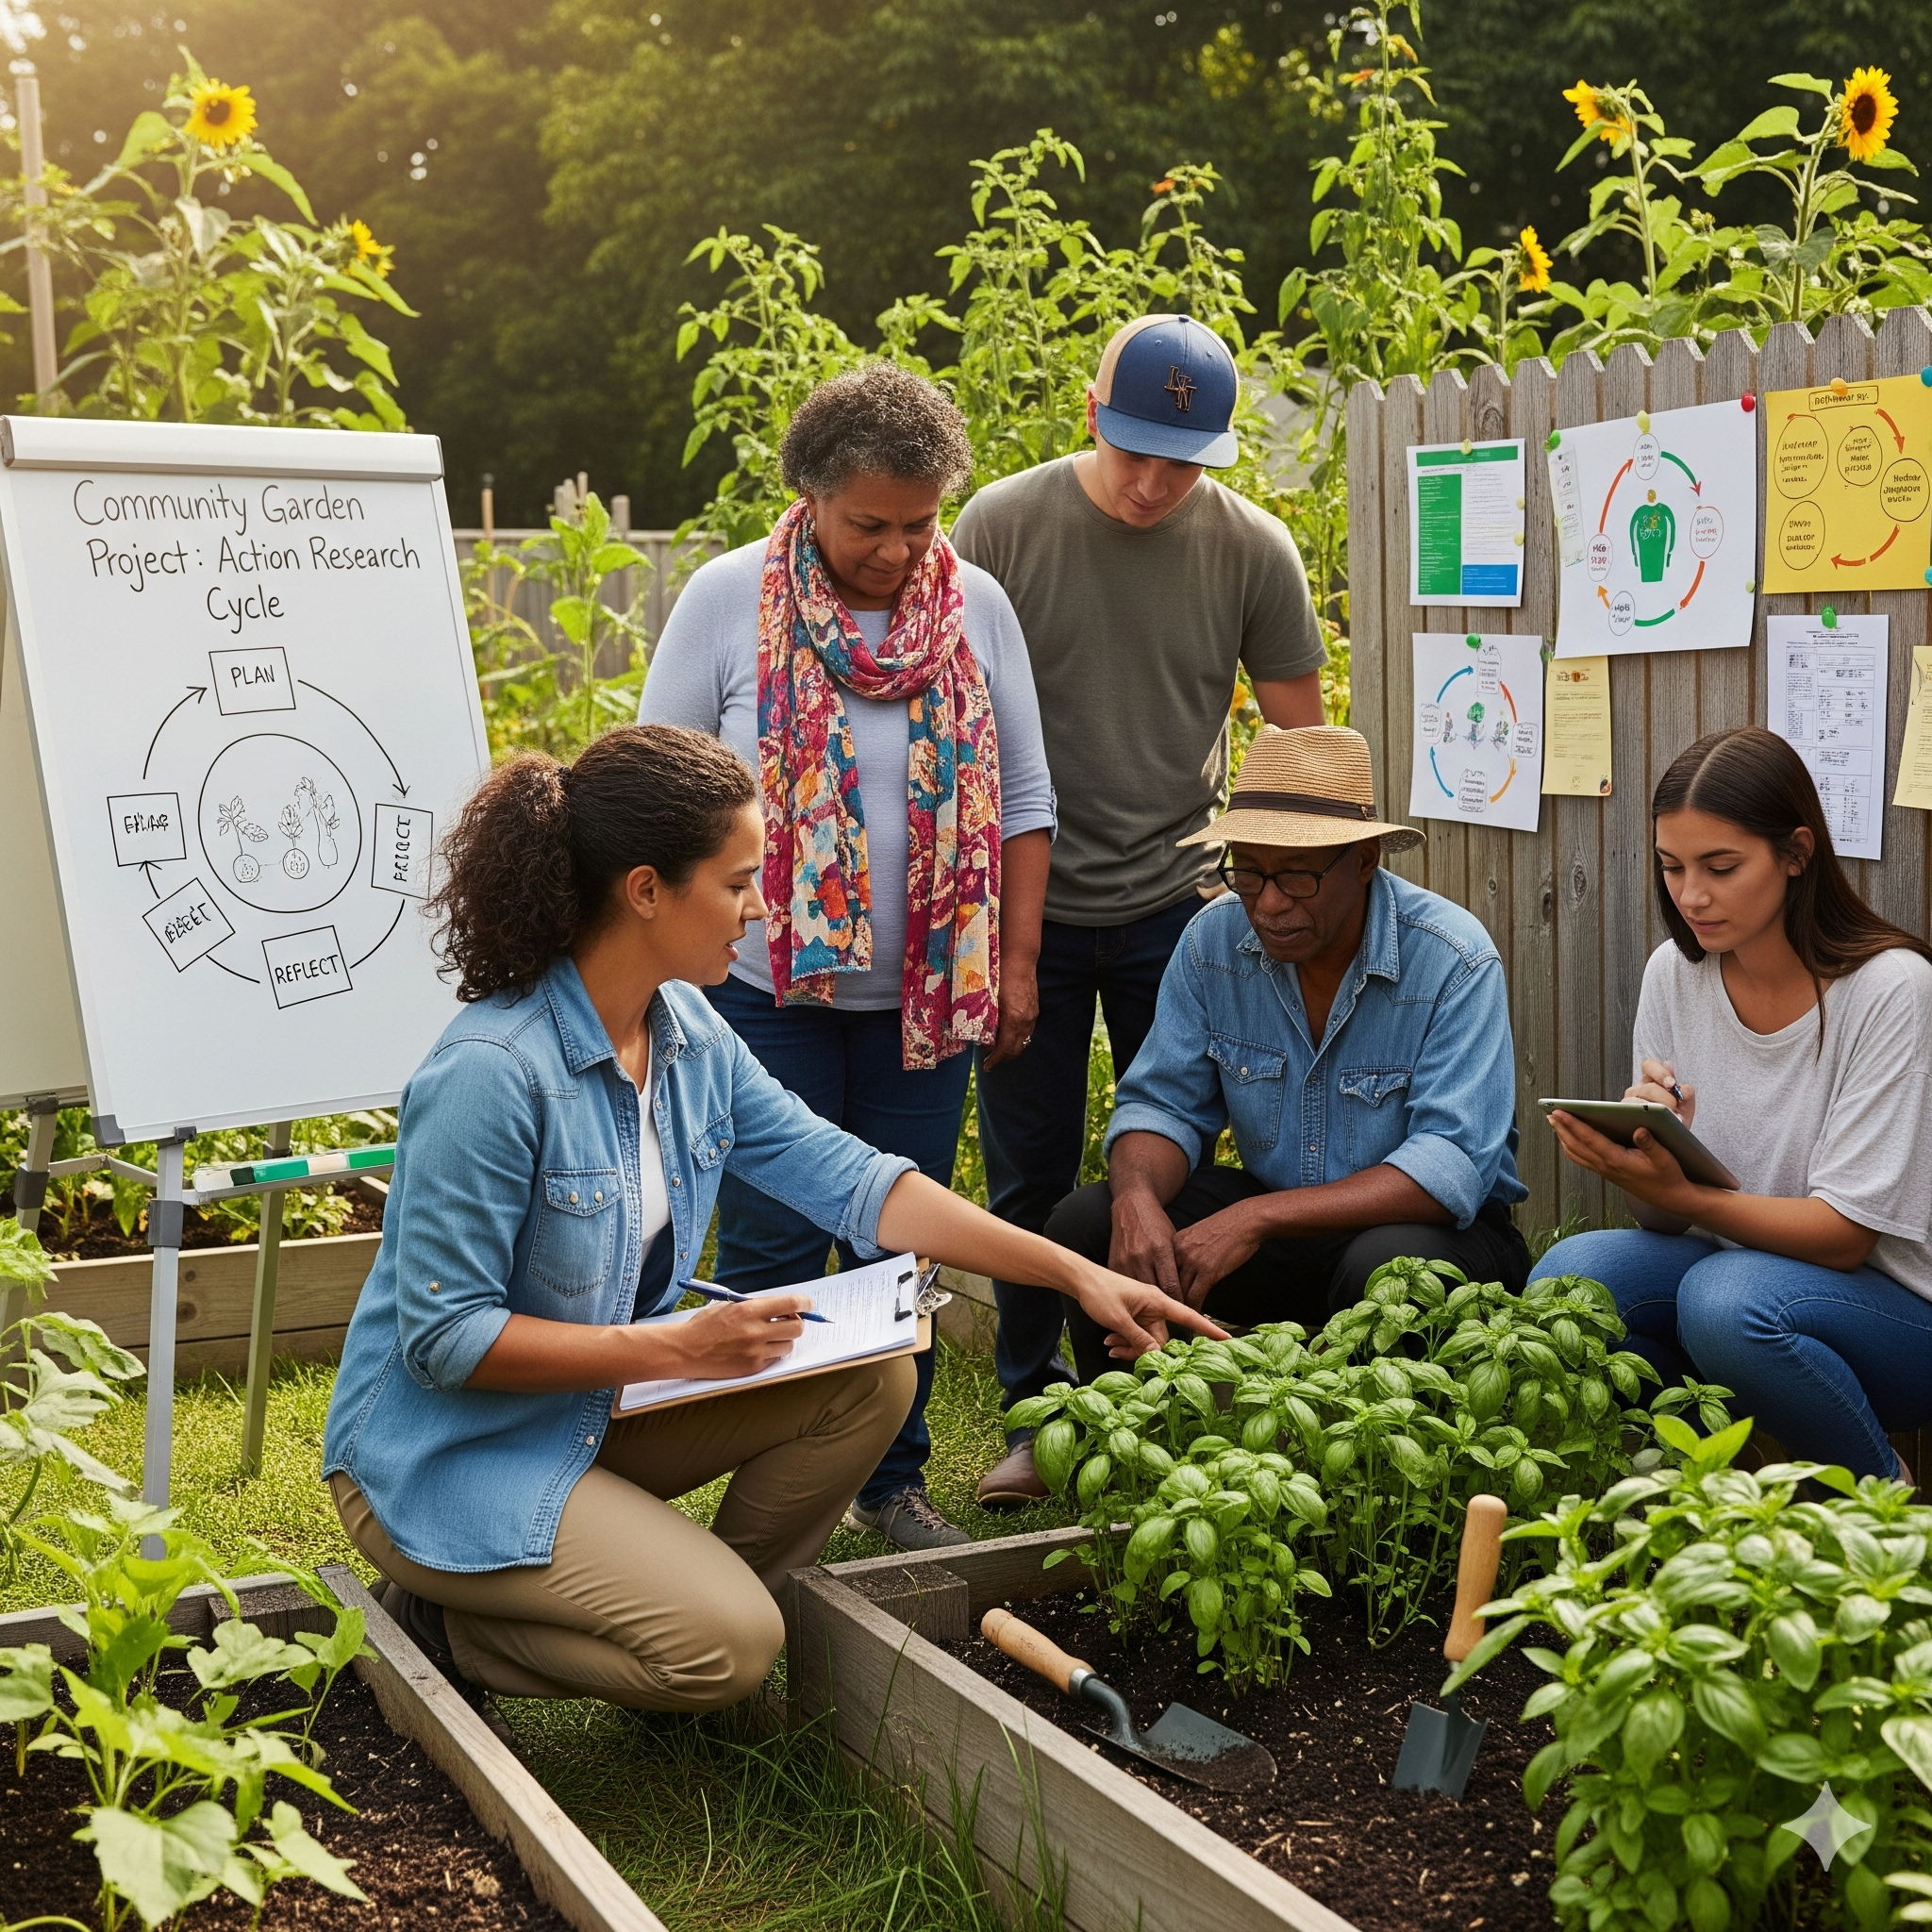
It’s like gardening 🌱: plant → water → observe → prune → repeat. Each cycle makes the garden healthier — and teaches you how to grow better next season
Use AR when…
- The problem is practical and local (bullying in a school, burnout on a hospital unit, long wait times in a city office).
- You can bring the right people to the table (those affected + those empowered to act).
- You are willing to share decisions, credit, and data.
Consider other approaches when…
- There is no realistic path to try changes (e.g., fixed policy, no resources).
- Stakeholders won’t share power or access.
- You need strict control/blinding that conflicts with co-design.
3) What Makes AR Different (5 pillars)
- Co-ownership: Participants help define the problem, choose methods, collect data, analyze, and co-author outputs.
- Usefulness: The work must make real improvements (not just a paper).
- Cyclic Learning: Short loops: Plan → Act → Observe → Reflect (repeat).
- Power Awareness: Name power differences; share credit and data access.
- Reflexivity: Researchers examine how their assumptions and role shape the work.
5) Variants You’ll Hear
🔎 What is Participatory Action Research (PAR)?
- PAR = Action Research + Social Justice.
- In regular Action Research, people affected by a problem are partners in solving it.
- In PAR, the community leads the research — they’re not just helpers, they are co-owners of the entire project.
👉 PAR is especially used when groups have been marginalized (ignored, oppressed, or silenced) and want to:
- Understand their situation (through data, stories, reflection).
- Take action to change it.
- Gain power over decisions that affect their lives.
⚖️ Core Principles of PAR
- Community leadership → the people most affected decide the questions, methods, and what counts as success.
- Empowerment → builds skills, confidence, and collective power in the community.
- Equity → researchers and participants share decision-making and credit equally.
- Action + Knowledge → the goal isn’t just to publish, but to create real-world change.
- Critical reflection → PAR asks: “Who benefits? Who is left out? How can we make things more just?”
🌀 How PAR Works (Step by Step)
It’s the same Plan → Act → Observe → Reflect → Adjust cycle as Action Research, but with more community ownership at every step:
- Build relationships & trust
- Researchers meet with the community.
- Spend time listening and understanding local concerns.
- Example: Meet with undocumented college students to hear what challenges they face.
- Co-define the problem
- Community members say what matters most to them.
- Example: Students say, “Our university claims to support us, but we still feel unsafe and excluded.”
- Co-design the research
- Decide together:
- What questions to ask.
- How to collect data (surveys, storytelling, photovoice, theater, etc.).
- How results will be used.
- Example: Students decide to use photovoice (photos they take to represent experiences).
- Decide together:
- Co-collect the data
- Community members gather data themselves, with support if needed.
- Example: Students photograph daily barriers (signs, offices, interactions) and write captions.
- Co-analyze the data
- Instead of researchers analyzing alone, the group sits down to interpret findings.
- Example: Students discuss their photos and identify themes like “lack of safe spaces” or “fear of deportation.”
- Take action together
- Decide what to do with the knowledge:
- Share with university leadership.
- Run awareness campaigns.
- Demand policy changes.
- Example: Students organize an exhibit of their photovoice project and present to the administration.
- Decide what to do with the knowledge:
- Reflect and continue
- Ask: Did this create change? What should we try next?
📚 Real PAR Examples
🏫 Education Example
- Community: Undocumented students at a university.
- Problem: School claims to be “undocufriendly” but doesn’t actually provide meaningful support.
- Method: Students co-research using interviews and photovoice.
- Action: They present findings to administrators, pushing for more legal resources, counseling, and safe reporting channels.
- Impact: Policy changes + stronger student organizing.
🏥 Healthcare Example
- Community: Patients in a low-income neighborhood.
- Problem: Local clinic hours don’t meet their needs.
- Method: Patients survey neighbors and keep diaries of their struggles accessing care.
- Action: Present data to the clinic → new evening and weekend hours are added.
- Impact: More access to healthcare, patients feel empowered.
🌍 Global Example
- Community: Farmers in rural India.
- Problem: Crop failure from climate change.
- Method: Farmers co-collect data on rainfall, soil, and yields.
- Action: They lobby for new irrigation systems and share findings with NGOs.
- Impact: Improved local agriculture and stronger farmer organizations.
🧾 PAR vs. “Regular” Action Research
| Feature | Action Research | Participatory Action Research (PAR) |
|---|---|---|
| Who drives the project? | Researchers + participants share | Community members lead, researchers support |
| Main focus | Solve a problem + improve practice | Solve a problem + empower community + shift power |
| Typical setting | Schools, hospitals, workplaces | Communities, marginalized groups, activism |
| Output | Better processes, reports, sometimes publications | Social change, policy impact, empowerment + knowledge |
| Methods | Surveys, interviews, observations | Often creative: photovoice, theater, storytelling, mapping |
✅ Layperson’s Takeaway
PAR = research + activism.
It’s not just about understanding a problem — it’s about the people most affected studying it, deciding solutions, and pushing for change together.
It asks:
- Who gets a voice?
- Who holds power?
- How can knowledge + action lead to justice?
👉 Quick way to explain it to a friend:
“Participatory Action Research is when the people with the problem are also the researchers. They study their own situation, decide what to do, and use the results to push for change. It’s about empowerment as much as it is about data.”
🔎 What is Community Based Participatory Research.
Community-Based Participatory Research (CBPR) is a research approach where communities and researchers are equal partners.
- The community = people living the issue (e.g., residents, patients, youth, farmers).
- The researchers = people with academic/scientific tools (e.g., professors, public health experts).
Together, they design and run the study.
👉 The goal is better health, stronger communities, and useful knowledge for everyone involved.
⚖️ Key Principles of CBPR
- Equal Partnership
- Researchers don’t “study” the community from the outside.
- Instead, the community sits at the table as co-leaders.
- Trust & Long-term Commitment
- CBPR isn’t a one-off project. It builds relationships for years.
- Co-learning
- Researchers bring technical skills.
- Communities bring lived experience.
- Both sides learn from each other.
- Balance of Knowledge & Action
- Academic knowledge = published articles, policy evidence.
- Community knowledge = practices that directly improve local life.
- Shared Ownership
- The community helps decide:
- The research questions.
- The methods.
- How results are shared.
- What actions to take after.
- The community helps decide:
🌀 How CBPR Works (Step by Step)
- Build a Partnership
- Researchers meet with community leaders/organizations.
- Trust-building: listening sessions, meetings, shared meals.
- Co-define the Problem
- Community says what matters most.
- Example: “Asthma rates are high in our neighborhood.”
- Co-design the Research
- Decide together:
- What data to collect (surveys, air samples, focus groups).
- Who collects it (community members often trained as co-researchers).
- Decide together:
- Co-collect the Data
- Residents may survey neighbors, run interviews, or monitor local environments.
- Co-analyze the Data
- Both researchers and community sit together to make sense of findings.
- Example: Graphs + community discussions = shared understanding.
- Take Action
- Results feed directly into action plans: health programs, policy advocacy, new services.
- Sustain the Partnership
- Even after the study ends, relationships continue.
🧾 Example 1: Health & Pollution
- Community: Residents in a city neighborhood.
- Problem: Kids have high asthma rates.
- Partnership: University researchers + local parents + a neighborhood clinic.
- Methods: Parents trained to measure air quality outside homes. Surveys given to families.
- Findings: Poor air quality near factories correlates with asthma flares.
- Action: Community + researchers lobby city council → new clean air rules.
- Impact: Pollution decreases, asthma cases drop, and community gains a lasting voice in policy.
🧾 Example 2: Indigenous Health
- Community: Native American tribe.
- Problem: High rates of diabetes.
- Partnership: Tribal leaders + university researchers.
- Methods: Tribal members co-designed culturally appropriate diet/exercise surveys.
- Findings: Lack of access to traditional foods was a major issue.
- Action: Tribe + researchers started a “traditional foods” program.
- Impact: Improved health outcomes + preservation of cultural food practices.
🧾 Example 3: Youth Violence
- Community: Teens in an urban neighborhood.
- Problem: Rising youth violence.
- Partnership: Local youth org + police + social scientists.
- Methods: Youth trained to interview peers; researchers analyzed patterns.
- Findings: Lack of after-school programs was a key driver.
- Action: Partnership created safe recreation spaces.
- Impact: Youth violence rates went down.
✅ Why CBPR Matters
- Communities get real solutions → not just academic reports.
- Researchers gain deeper insights → studies are more accurate because they include lived experience.
- Policies change → because findings are co-owned, they have more legitimacy and power.
🗣️ Layperson’s Takeaway
CBPR is like building a bridge:
- Researchers bring the bricks (methods, data skills).
- Communities bring the blueprint (real knowledge of problems + lived experience).
- Together, they build something stronger than either could alone.
👉 Quick way to explain CBPR to a friend:
“Community-Based Participatory Research is when scientists and communities team up as equals. The community helps choose the questions, collect data, and use the results to improve life right where they live.”
- Design-Based Research (DBR): AR in education/learning—iteratively designing/testing instructional tools.
- Action Learning / Practitioner Inquiry: Employees or teachers systematically improve their own practice.
6) Roles & Governance (make “with” real)
- Core Team (4–8 people): Those affected + implementers + 1–2 researchers/facilitators.
- Advisory Circle: Wider voices you check in with monthly.
- Decision Rules (write them down):
- How decisions are made (consensus? vote?)
- Who owns data? Who can access it?
- How authorship/credit will work
- Any compensation for time/effort
- 1-page MoU: Scope, timelines, credit, data, conflict resolution.
7) Research Questions (AR-style)
- Effectiveness: “What happens to [outcome] when we implement [change] in [setting]?”
- Experience: “How do [participants] experience [change] (what helps/hinders)?”
- Context: “For whom and under what conditions does [change] work?”
8) Methods Toolkit (keep it light & useful)
Qualitative: brief interviews (10–15 min), focus groups, observations, diaries/voice notes, photovoice, journey maps.
Quantitative: pulse surveys (3–5 items), simple counts (incidents, wait time), admin logs, short scales.
Creative: photovoice, story circles, skits, collage—great for surfacing emotions/insights.
Rule of thumb: if the data won’t be used at the next meeting, don’t collect it.
9) Practical Examples (end-to-end)
A) School Bullying (6-week cycle)
- Plan: Students + teachers map bullying hotspots; test a peer-ally program and hallway presence map for 3 weeks in Grade 7.
- Act: Train peer-allies; adjust teacher hall duty.
- Observe: Incident logs ↓ 30%; short student survey shows “feel safer” +0.6/5; two hotspots remain.
- Reflect: Peer-ally popular; improve visibility at hotspot #2; create a 2-min check-in script for allies.
- Repeat: Expand to Grade 8; re-measure.
B) Hospital Nurse Burnout (ties to compassion work)
- Plan: Two units trial (a) 2-minute compassion huddles, (b) quiet corner, (c) schedule tweak at peak hour.
- Act: 4-week pilot; track missed breaks, mood (1–5), near-misses, and 5-min weekly group debriefs.
- Observe: Missed breaks ↓ 25%; mood +0.7; night shift adoption uneven.
- Reflect: Create a one-page huddle script + rotating “huddle host”; add night-shift champion.
- Repeat: Extend 4 weeks; compare day vs night.
C) City Service Wait Times
- Plan: Residents + clerks co-design “fast lane” desk for easy requests.
- Act: 3-week pilot on Mon/Wed mornings.
- Observe: Average wait ↓ from 41 to 26 minutes; residents cite clearer signage as key.
- Reflect: Keep “fast lane,” add bilingual signs; test Tue afternoons next.
10) Data & Rigor (how AR stays credible)
Validity criteria that fit AR:
- Process validity: You followed a disciplined cycle with transparent notes.
- Democratic/dialogic validity: Diverse voices truly shaped decisions.
- Outcome validity: Things actually improved (on outcomes people value).
- Catalytic validity: Participants’ understanding and capacity to act grew.
- Credibility: Triangulation (multiple data sources), member checks (participants verify interpretations), audit trail (brief log of decisions/data).
Analysis basics (keep it simple, but real):
- Quant: pre/post counts, short trend lines, subgroup splits (e.g., nights vs days).
- Qual: rapid coding of notes/quotes → 3–6 themes; 2–3 quotes per theme; check with participants.
- Integration: table with Outcome metric + Process metric + Key quotes for each cycle.
11) Ethics for “with, not on”
- Co-consent: Agree together what’s recorded and how it’s shared.
- Reciprocity: Pay/credit people for time; make outputs useful to them.
- Confidentiality vs voice: Some want anonymity; some want their names—let them choose.
- Data access: Store data where partners can see it; agree on reuse.
- Right-sizing: Don’t overload people with tasks; protect time.
(If your university requires IRB: frame the cycles, co-consent, minimal risk, and community benefit.)
12) Common Pitfalls & Fixes
- Token participation → Rotate facilitation; share docs; co-author results.
- Overpromising → Promise one small cycle; deliver; then scale.
- Scope creep → Keep a backlog; finish today’s cycle first.
- Leadership churn → Re-confirm sponsorship after personnel changes.
- Invisible labor → Track hours; compensate; list contributors by name/role.
13) A 10-Step Starter Plan (8–10 weeks)
- Convene a core team (6–8 people).
- Draft a 1-page MoU (decisions, data, credit, compensation).
- Co-define the problem and success metrics (include well-being).
- Pick one tiny change (doable in 2–4 weeks).
- Co-design a light data plan (2 metrics + 1 story method).
- Prep tools (1-page script, QR survey, tally sheet).
- Run the pilot (protect time/materials).
- Debrief (what worked, why, for whom, at what cost).
- Decide: adopt, adapt, abandon; log the decision + rationale.
- Share back (1-page summary, wall poster, brief talk) and schedule the next cycle.
14) Ready-to-Use Fill-Ins
A) Problem statement
In [setting], [group] experience [problem] especially [where/when]. We will test [small change] to improve [outcome] over [timeframe].
B) Research questions
- What happens to [outcome] when we implement [change]?
- How do [group] describe their experience of [change]?
- What helps/hinders [change], and what should we adjust next?
C) Mini data plan
- Outcome metric: e.g., incidents/week, wait time, missed breaks.
- Process metric: e.g., % of days the new practice actually ran.
- Experience/equity: 3-item pulse (1–5), split by shift/team/grade.
- Qual: 3–5 quick interviews or one 10-min focus huddle/week.
D) 6-question interview (10 min)
- What changed for you this week?
- When did it help most?
- When did it not help?
- What made it easier/harder?
- What should we change next cycle?
- Anything else we should know?
E) Success scorecard (example)
- Breaks taken (%)
- Mood (1–5)
- Incidents or near-misses (#)
- Adoption (practice run today? yes/no)
- Equity (nights/weekends vs days)
- Stories (2–3 quotes per cycle)
15) How to Write It Up (short & strong)
- Context & partners (who, where, why this matters).
- AR approach (cycles, roles, governance, ethics).
- Change tested (what/why).
- Data (metrics + brief qual methods).
- Findings (table: cycle → outcome/process/quotes → decision).
- Learning (what worked, for whom, under what conditions).
- Next steps (what the team will try next, sustainability plan).
- Co-authorship/credit (list all contributors).
16) Beginner’s One-Page Example (Nurse Burnout)
Problem: Night-shift nurses report missed breaks and high stress in Unit B.
Goal: Reduce missed breaks by 20% and raise mood +0.5/5 in 4 weeks.
Change: 2-minute Compassion Huddle start of shift + quiet corner + charge-nurse micro-rebalancing at hour 3.
Metrics: % breaks taken; mood 1–5; near-misses; adoption (huddle yes/no).
Qual: 5 mini-interviews each week (2–3 minutes).
Results (Cycle 1): Breaks ↓ from 58% missed to 33% missed; mood +0.6; adoption 70% (nights lower).
Quotes: “Huddle reminds me I’m not alone.” / “Night shift needs a host.”
Decision: Keep; add rotating Huddle Host and signage; train night champion.
Next: Run Cycle 2; compare day vs night
🔎 What is Design-Based Research (DBR)?
Design-Based Research is about designing, testing, and improving educational tools, strategies, or programs inside real classrooms or learning environments.
It’s not done in a lab, but in the messiness of real life, with teachers and students as partners.
👉 Think of DBR as “research through designing and redesigning.”
⚖️ Core Features of DBR
- Practical + Theoretical
- Goal is to improve practice now (help teachers, students, schools) and
- Build theory about how learning works in general.
- Iterative
- You don’t design once. You test, tweak, test again (multiple cycles).
- Collaborative
- Teachers, students, and researchers co-create and co-refine tools.
- Contextual
- Takes place in real-world classrooms, not controlled labs.
- Design Principles
- Each cycle produces design principles → guidelines others can use later.
🌀 The DBR Process (Step by Step)
- Identify the Problem
- Work with teachers to find a practical challenge.
- Example: “Students struggle to understand fractions.”
- Design an Intervention
- Create a tool, method, or curriculum idea to address the problem.
- Example: A fractions game app where students use visuals instead of just numbers.
- Implement in the Classroom
- Try it out in real classrooms.
- Collect Data
- Observe students, interview teachers, analyze test results, record classroom interactions.
- Analyze & Reflect
- What worked? What failed? What surprised us?
- Redesign
- Improve the tool/strategy based on evidence.
- Repeat (Iterate)
- Each cycle makes the design stronger and the theory sharper.
📚 Example 1: Math Education
- Problem: Middle schoolers can’t visualize fractions.
- Design: Create a digital game where students “cut pizzas” into fractions.
- Test: In 3 classrooms, students play for 2 weeks.
- Observe: Engagement is high, but some kids still struggle with improper fractions.
- Redesign: Add levels with “stacking pizzas” to teach improper fractions.
- Repeat: Test again. Over time, the design improves, and researchers learn “visual representation + progressive challenge helps students master fractions.”
📚 Example 2: Science Learning
- Problem: Students memorize science facts but don’t connect them to real life.
- Design: Teachers + researchers design project-based modules (e.g., students test local water quality).
- Test: Run the project in 2 schools.
- Data: Students show more curiosity, but some fail to link back to scientific concepts.
- Redesign: Add structured reflection sessions where students connect data to textbook content.
- Repeat: Next cycle shows improved concept retention.
📚 Example 3: Online Learning
- Problem: In online courses, students drop out because they feel disconnected.
- Design: Researchers + instructors create a peer support discussion board with guided prompts.
- Test: Run for one semester.
- Data: Engagement rises, but some students still lurk silently.
- Redesign: Add peer badges and short video introductions.
- Repeat: Retention rates improve.
✅ Why DBR Matters
- For practice: Teachers and schools get immediate solutions tailored to their classrooms.
- For theory: Researchers uncover design principles others can adapt.
- For learners: Students benefit from new, engaging ways to learn.
🗣️ Layperson’s Takeaway
👉 DBR is like beta-testing education tools in real classrooms.
Instead of waiting years for a polished product, you:
- Try a prototype.
- See how real students/teachers respond.
- Tweak and test again.
- Over time, you create both better learning tools and knowledge about how learning works.
✨ Quick way to explain it to a friend:
“Design-Based Research is when teachers and researchers design new ways of teaching, test them in real classrooms, and improve them step by step. It helps students right away and builds knowledge that other teachers can use.”
🔎 What is Action Learning / Practitioner Inquiry?
- Action Learning = when employees or professionals learn by tackling real problems together, reflecting on their actions, and applying what they learn immediately.
- Practitioner Inquiry = when individual professionals (like a teacher or nurse) systematically study their own work in order to improve it.
👉 Both are about practitioners being researchers of their own practice.
Instead of waiting for an outside expert to tell them what to do, they become the expert of their own situation.
⚖️ Core Principles
- Work on real problems → not theory in the abstract, but actual challenges faced every day.
- Reflection → take time to pause, ask questions, and make sense of what’s happening.
- Collaboration (esp. in Action Learning) → colleagues form a “set” (small group) to support each other’s learning.
- Cycles of learning → just like Action Research: Plan → Act → Observe → Reflect → Adjust.
- Documentation → practitioners write memos, logs, or reports to track learning (this is the “inquiry” part).
🧾 Example 1: Teacher as Practitioner-Inquirer
- Problem: A teacher sees that many students are not doing homework.
- Inquiry: She keeps a journal, interviews a few students, and looks at homework completion rates.
- Action: She tests giving more choice in assignments.
- Observation: Homework completion rises from 40% to 65%.
- Reflection: Students liked choice, but some still struggled with time management.
- Next step: Add a short in-class prep period for homework.
👉 She has now researched and improved her own teaching practice.
🧾 Example 2: Action Learning in a Workplace
- Setting: A company struggles with customer complaints.
- Group: 6 employees from different departments form an Action Learning Set.
- Process:
- Meet every 2 weeks.
- Each brings a real challenge.
- The group doesn’t give direct solutions — they ask questions, share experiences, and reflect.
- Members test new approaches between meetings.
- Outcome: Over 3 months, they identify root causes (poor communication between departments), test fixes, and complaints go down.
👉 They’ve learned while solving the problem.
🧾 Example 3: Nurse Practitioner Inquiry
- Problem: A nurse notices patients often miss medication times.
- Inquiry: She documents when/why doses are missed.
- Action: She tests using color-coded reminder cards.
- Observation: Missed doses drop by 30%.
- Reflection: Cards help, but older patients struggle to read small text.
- Next step: Introduce larger print + verbal reminders.
👉 The nurse is both caregiver and researcher of her own practice.
✅ Benefits
- Builds professional confidence — staff see they can improve practice themselves.
- Creates a culture of continuous improvement.
- Generates practical, context-specific solutions (not one-size-fits-all).
- Encourages peer support and accountability (esp. Action Learning Sets).
⚠️ Challenges
- Requires time for reflection (hard in busy workplaces).
- Needs a safe culture (staff must feel comfortable admitting problems).
- Must balance rigor with practicality (not every practitioner has research training).
🗣️ Layperson’s Takeaway
Action Learning / Practitioner Inquiry = professionals becoming researchers of their own practice.
- A teacher tweaks lessons, studies results, and improves teaching.
- A nurse tracks patient care, tests a fix, and shares results with the team.
- A work team meets regularly, asks each other tough questions, and experiments with solutions.
👉 It’s about solving real problems while learning from them in a systematic way.
✨ Quick way to explain to a friend:
“Action Learning and Practitioner Inquiry are when people study and improve their own work. Instead of waiting for outside experts, they try changes, reflect, and learn from the results.”


Leave a Reply