


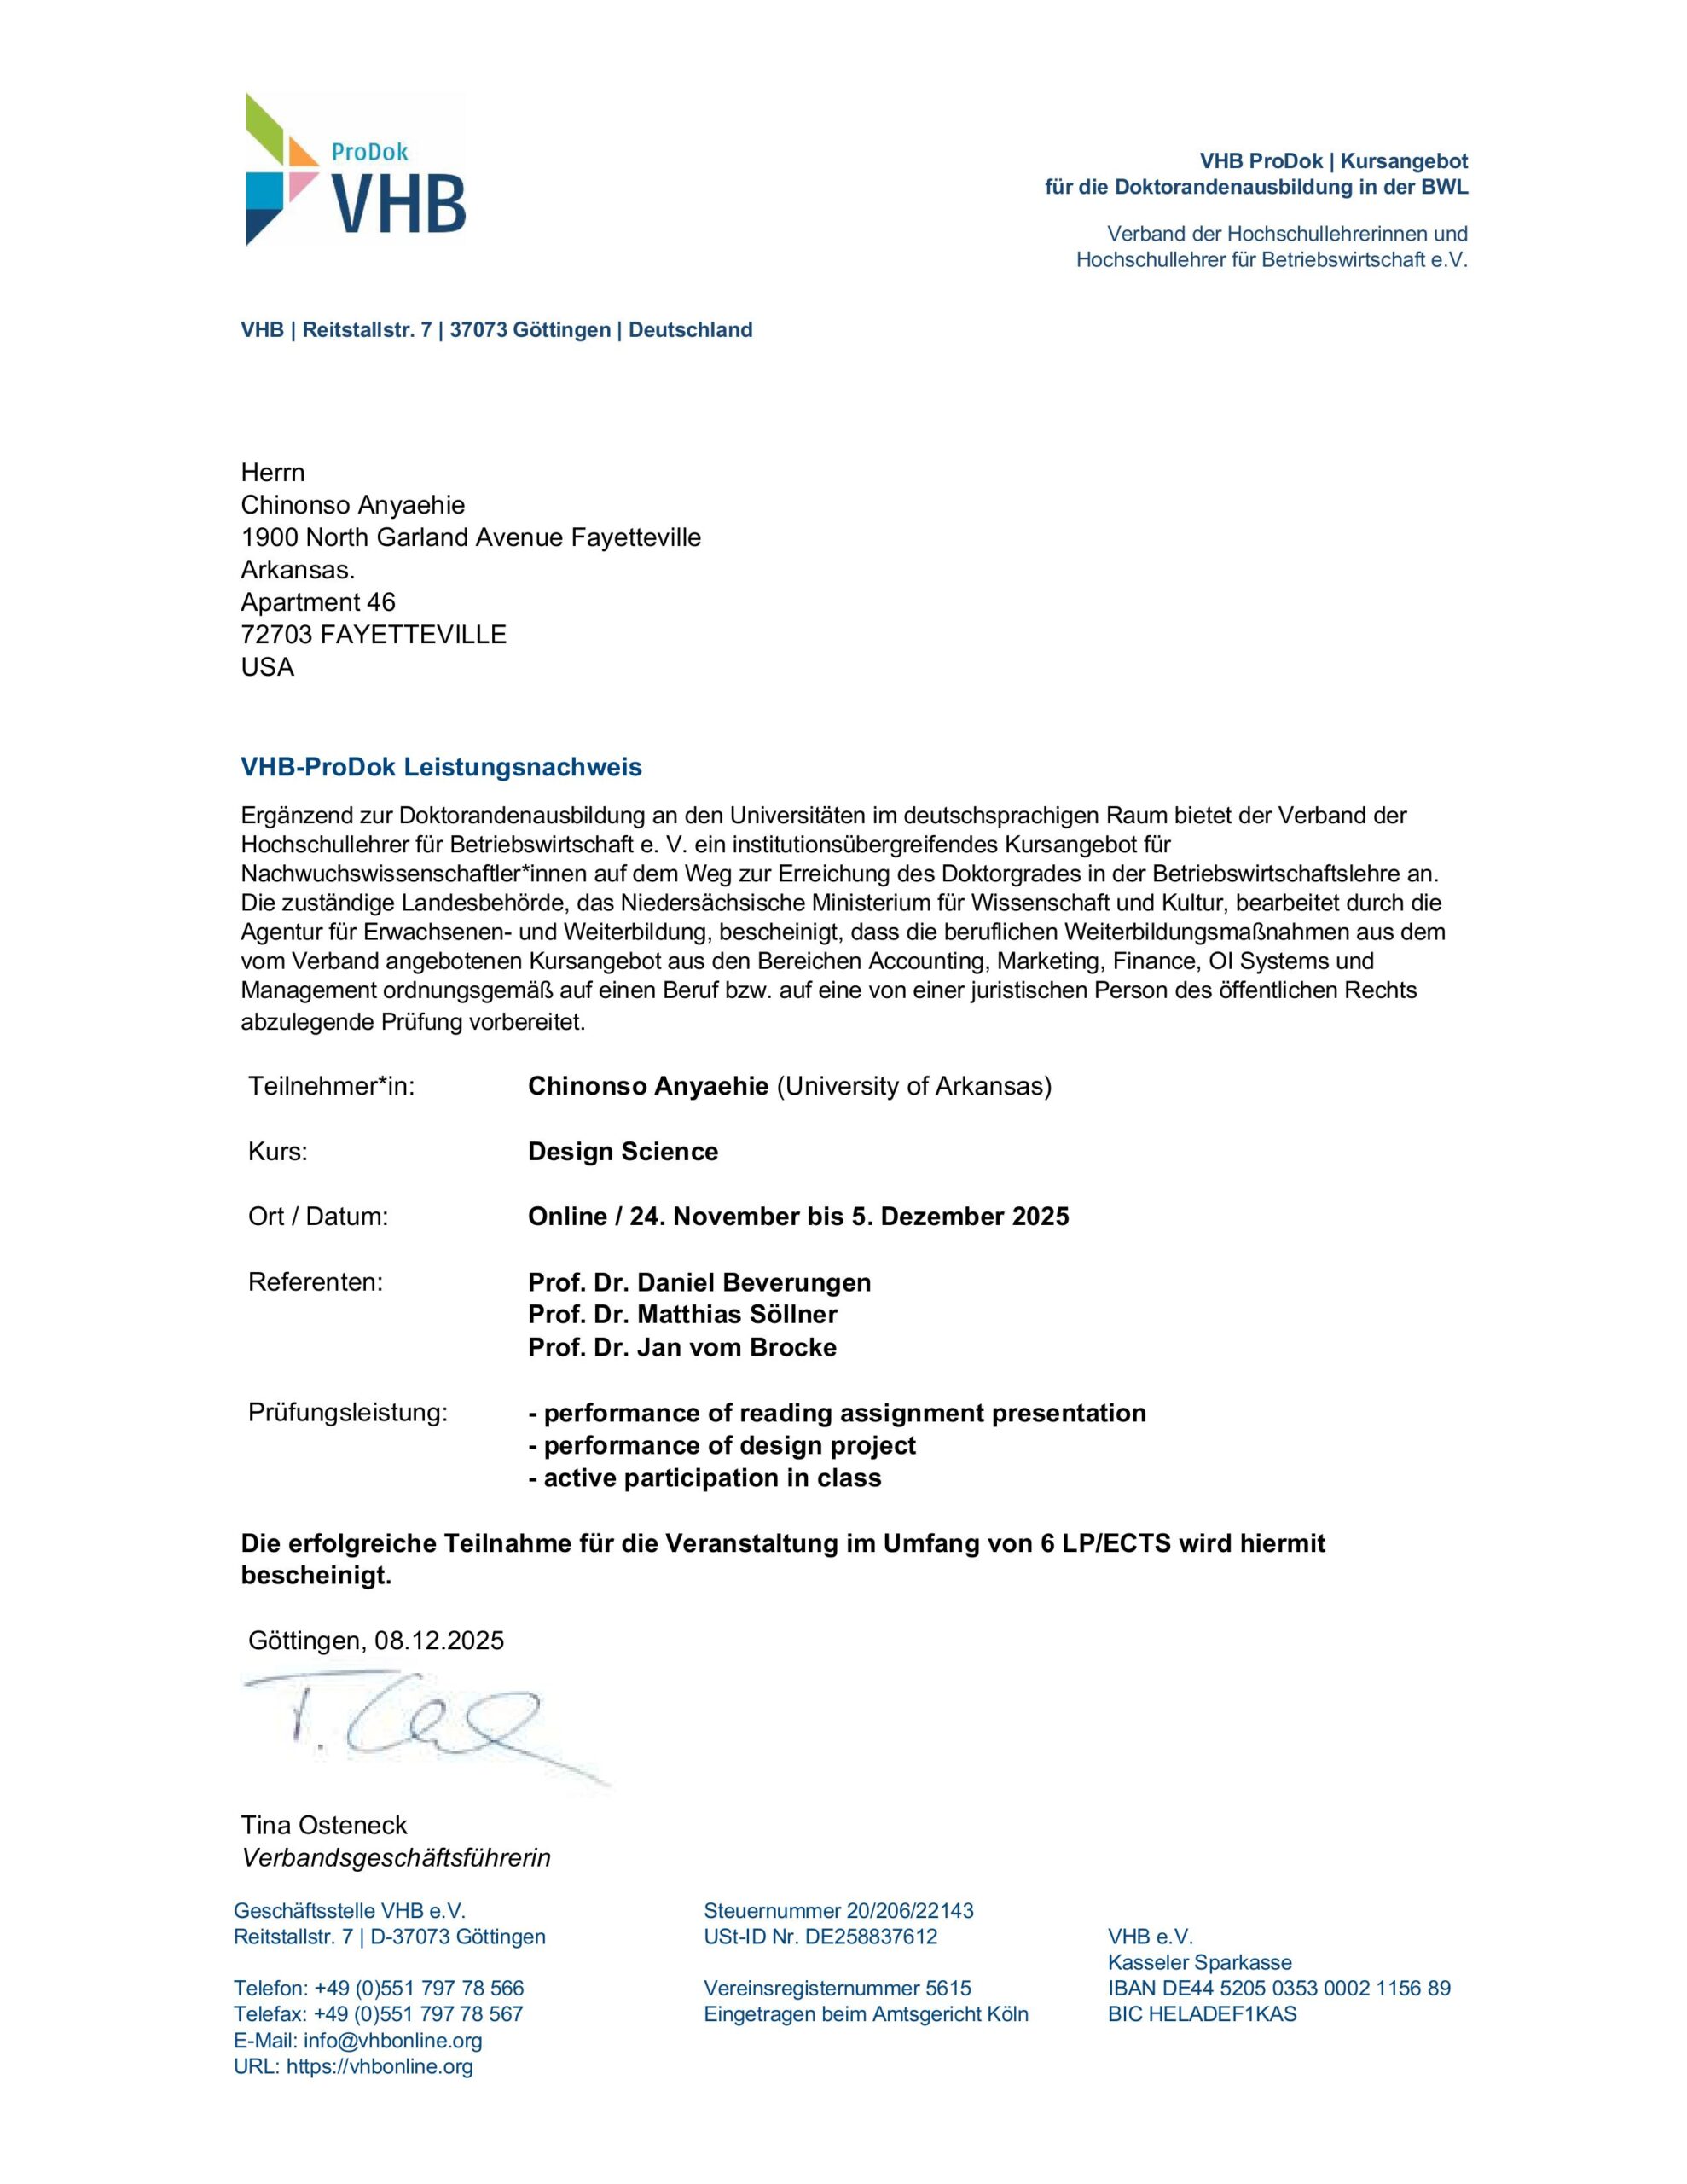

What is Survival Analysis?
Survival analysis is a special way of analyzing how long it takes for something to happen while considering that for some subjects, the event hasn’t happened yet when the study ends.
Let’s break it down with a real-life example:
Imagine you open a new gym membership program and track how long customers stay subscribed before canceling. Some customers cancel in a month, some in a year, and some are still members when you stop tracking.
- Regular analysis might ignore the members who haven’t canceled yet, leading to incomplete conclusions.
- Survival analysis makes sure those members are still counted properly.
This makes survival analysis different from standard time-based analysis, because it deals with incomplete or “censored” data, where some people haven’t yet experienced the event.
Where Do We Use Survival Analysis?
Survival analysis isn’t just for survival in medical studies—it applies to many real-world situations where we track how long things last before an event happens.
Everyday Examples of Survival Analysis
📌 Medical Research:
- How long do patients survive after a new treatment? (Some may still be alive when the study ends.)
- How long does it take for a drug to start working?
📌 Business & Marketing:
- How long do customers stay with a subscription before canceling?
- How long does a new employee stay in a company before quitting?
📌 Finance & Banking:
- How long before a customer defaults on a loan?
- How long does a customer stay loyal to a credit card provider before switching?
📌 Technology & Engineering:
- How long does a laptop battery last before dying?
- When will a car engine part break down?
📌 Employment & Economics:
- How long does an unemployed person stay jobless before finding a new job?
- How long does a startup company survive before going out of business?
How Is Survival Analysis Different from Other Types of Data Analysis?
| Type of Data | What It Tracks | Example |
|---|---|---|
| Cross-Sectional Data | Snapshot at a single moment | Surveying people’s incomes in 2023 |
| Time Series Data | A single thing changing over time | Tracking daily stock prices of Tesla for a year |
| Panel Data | Multiple things tracked over time | Following the same group of workers’ salaries for 10 years |
| Survival Analysis | How long something lasts before an event happens | Measuring how long before a customer cancels a service |
Survival analysis is unique because it:
✔️ Tracks time until an event happens instead of just looking at changes over time.
✔️ Handles situations where the event hasn’t happened yet for some people.
Key Concepts in Survival Analysis
Survival analysis has special mathematical tools to study time-to-event data properly.
1. Censoring: What Happens When the Event Hasn’t Happened Yet?
- In survival analysis, some people haven’t yet reached the event by the time we stop tracking them.
- Example: If a medical trial follows 100 cancer patients for 5 years, and some are still alive after 5 years, we don’t know their final survival time yet.
- Instead of ignoring them, survival analysis includes their data as “right-censored” cases, meaning they still provide useful information up to that point.
2. Hazard Function: What’s the Risk of the Event Happening?
- The hazard function measures the risk of the event happening at a specific moment in time.
- Example: If studying employee turnover, the hazard function tells us:
- If an employee has worked at a company for 2 years, how likely are they to quit in the next month?
3. Survival Function: What’s the Probability of Lasting Longer?
- The survival function calculates the probability of something continuing to “survive” beyond a certain time.
- Example: If tracking customers, the survival function answers:
- What % of customers are still subscribed after 3 months? 6 months? A year?
How Do We Analyze Survival Data?
Survival analysis uses special methods to study time-to-event data:
📊 Kaplan-Meier Estimator → Think of it as a scoreboard, tracking how many people “survive” at different time points.
- Example: A graph showing what % of cancer patients are still alive after 1, 2, or 5 years.
📈 Cox Proportional Hazards Model → This checks what factors increase or decrease survival time.
- Example: If analyzing job seekers, it can measure how age, education, or industry affect how long it takes to get a job.
⚠️ Hazard Function Analysis → Measures the risk of the event happening at different times.
- Example: In car manufacturing, it can show when a car part is most likely to fail over its lifespan.
📉 Weibull Regression → A statistical model that predicts when something will fail based on past trends.
- Example: Used in engineering to predict when a machine part needs replacement before it breaks.
Why Is Survival Analysis Useful?
✅ It includes people or items where the event hasn’t happened yet.
- Example: If some customers haven’t canceled their subscription yet, their data is still useful.
✅ It helps businesses predict when customers will leave.
- Example: If a company knows the average customer stays for 6 months, they can work on improving retention strategies.
✅ It gives better risk predictions than regular data analysis.
- Example: Doctors can predict which patients are at the highest risk of dying and adjust treatment plans accordingly.
✅ It works across many industries.
- Medicine, business, engineering, economics—anywhere we need to track how long something lasts!
Final Takeaway
💡 Survival analysis isn’t just about life and death—it’s about understanding how long something lasts before an important event happens.
✔️ If you’re tracking how long something lasts (before a job is found, a customer leaves, or a machine part breaks), survival analysis is the best tool.
✔️ It works even when the event hasn’t happened for everyone yet, making it more realistic than regular analysis.
✔️ It’s used in medicine, business, marketing, economics, and engineering to predict durations and risks over time.
🚀 In short: If you’re asking “How long until this happens?”—survival analysis is the answer!


Leave a Reply