


With so much of our world becoming digital, many believe that the huge amount of digital data available could completely change how we study social behavior and challenge the way things have traditionally been done. By closely analyzing this digital data (often called “trace data” because it leaves a digital trail of human activity), researchers can gain deeper and more accurate insights into how people interact and behave.
However, understanding this data requires advanced tools to create visuals, identify patterns, and even make predictions. While these tools are helpful, they don’t automatically produce “theories”—which are deeper explanations of why things happen. To truly make the most of this data, researchers need a structured approach to turn it into meaningful, new theories.
Let’s break this down step by step into very simple and easy-to-follow terms:
1. What is “trace data”?
- In our everyday digital lives—social media, online shopping, smartphone apps—we leave behind a record of what we do. These records are called trace data, because they show the traces or footprints of our actions (like posts, clicks, location check-ins, etc.). Researchers want to use this massive amount of information to better understand people and society.
2. Why do we need a special approach?
- There’s so much trace data out there that it can be overwhelming. We need a clear, step-by-step method to sort through it, analyze it, and come up with fresh insights or “theories” about human behavior. The approach the authors propose is a blend of two methods:
- Grounded Theory Method (GTM): A way of creating theories by looking at data without preconceived ideas. You let the data “speak” and guide you.
- Computational Theory Discovery (CTD): Using powerful computer tools and algorithms to find patterns in large sets of data.
3. Why “computationally intensive”?
- This process requires a lot of computer power and human effort. It’s not just people manually looking at data (as in traditional GTM), and it’s not just computers automatically spitting out results (as in some CTD approaches). It’s a mix of both. That’s why they call it “computationally intensive”: humans and machines work together in a back-and-forth process.
4. Key steps in the process:
- Sampling
- What it means: You can’t analyze all trace data (there’s too much!), so you pick a subset that’s most relevant to your question. This is like choosing which ingredients you want to use in a recipe.
- Synchronic Analysis
- What it means: Taking a “snapshot” of the data at a single point in time. It’s like freezing a moment to see what’s happening right then and there, without worrying about the past or future.
- Lexical Framing
- What it means: This is about labeling or describing what you see using words and concepts that help you make sense of the data. The authors call this vocabulary the “lexicon.”
- Example: If you call a certain behavior “friendly” instead of “marketing-driven,” you will end up interpreting the data in a different way. Your choice of words (the “lexicon”) sets the stage for the kind of theory you’ll build.
- Diachronic Analysis
- What it means: Now you look at how things change over time. Instead of a snapshot, you watch how the data “moves” from one point in time to another (like a short video clip).
- Emergence Through Iteration
- What it means: You repeat these steps over and over, each time refining how you sample data, describe it, and analyze it. In each round, new ideas or insights—called “emergence”—can pop up. It’s like going back to your recipe multiple times, tasting it, adjusting ingredients, and improving the dish step by step.
5. Why does the choice of words (lexicon) matter so much?
- The words you use to describe what you’re seeing can open up or close off certain ways of understanding the data.
- If your words are too narrow, you might miss important patterns.
- If your words are too broad, you might overlook interesting details.
- This “lexicon” shapes your entire interpretation. Think of it like a pair of glasses: the lens color (in this case, your words) changes how you see everything.
6. Putting it all together:
- Researchers want to create new explanations (theories) about human behavior using the flood of digital information people leave behind.
- To do this effectively, they use a mixed approach of both manual analysis (like carefully reading and interpreting data) and computer-based methods (like algorithms and pattern detection).
- They follow specific steps (sampling, synchronic analysis, lexical framing, diachronic analysis) repeatedly, each time letting new ideas “emerge.”
- Throughout the process, they pay special attention to the vocabulary they use because it strongly influences the kind of theory they can build.
7. In everyday terms:
Imagine you have a huge pile of photos from social media. You want to figure out how people’s moods change over time. You wouldn’t just randomly flip through photos and guess; instead, you:
- Pick some photos that seem most interesting (sampling).
- Look at the photos from one particular day or event (synchronic).
- Label what you see (e.g., “happy faces,” “group gatherings,” “outdoor setting”)—your choice of words shapes how you understand what’s going on (lexical framing).
- Compare how these labels or behaviors change across different days or events (diachronic).
- Go back to your photo set, maybe pick new photos or refine your labels, and do it again. Each time, you might spot new patterns or better labels. That’s emergence through iteration.
By carefully following these steps and making sure you’re aware of how your words guide your interpretation, you gradually build a stronger explanation—or theory—about people’s behavior.
Real-World Example: Analyzing TikTok Trends
1. Sampling: Picking 500 Viral Videos
- Why Sampling Matters
There’s an overwhelming amount of TikTok content, so you need a workable subset. Selecting about 500 “viral” videos (e.g., >1M views or >100K shares within a month) strikes a balance:- Too few (like 50) might lead to random or misleading patterns.
- Too many (like 10,000) becomes unwieldy for manual review.
- Example Criteria
- Timeframe: January–March 2024
- Hashtags: #ViralChallenge, #Trending
- Sounds: Popular audio clips like “Oh No” or “Savage Love”
- Content variety: Dance, comedy, tutorials—no single category dominates.
2. Synchronic Analysis: The “Snapshot” of Trends
- What Happens
Researchers focus on a single “slice” of time—say, only the videos posted in January 2024—to spot immediate commonalities. - Human Step
- Manually watch a subset (50–100 videos).
- Notice a recurring detail: many of these videos use the same few songs or sound bites.
- Computer Step
- Use audio-recognition software (e.g., Shazam’s API) to analyze all 500 videos.
- Find that 70% share the exact same song or sound effect.
- Key Insight
At this moment, TikTok virality seems heavily driven by a single audio trend.
3. Lexical Framing: Naming the Pattern
- Defining the Vocabulary
Researchers decide on a term like “sound-driven trends” instead of “music trends” to include voice clips, remixes, or other non-musical audio. - Why It Matters
- The chosen label (“sound-driven”) guides future analysis.
- A narrower term like “music trends” might overlook popular voice overs or ambient sounds that also go viral.
4. Diachronic Analysis: Tracking Changes Over Time
- What Happens
Researchers extend the analysis beyond January to February and March 2024 to see how the trend evolves. - Computer Step
- Plot how many videos continue using the same sound over three months.
- Result: 70% in January → 40% in February → 10% in March.
- Human Step
- Watch some March videos.
- Observe that creators have either moved on to new sounds or are openly mocking the old one.
- Read comments complaining about hearing the same clip “too many times.”
- Key Insight
Once a sound saturates the platform, it loses novelty—and with that, its viral spark.
5. Building the Theory
- Emerging Theory
“TikTok trends are largely ‘sound-driven’: they go viral when a fresh, catchy audio track appears, but quickly fade due to oversaturation.” - How We Got Here
- Sampling identified high-impact videos.
- Synchronic Analysis revealed a dominant sound at a single point in time.
- Lexical Framing ensured that non-music sounds were included.
- Diachronic Analysis showed how quickly the trend dissipated.
Why This Matters
A. Better Theories Through Human–Computer Collaboration
- Human Strengths
- Explaining why a particular sound resonates (e.g., nostalgia, humor).
- Interpreting user comments and context clues.
- Computer Strengths
- Handling large data sets.
- Quantifying exactly how widespread a trend is.
- Avoiding Bias
- Humans might focus on what they find entertaining.
- Algorithms ensure broader coverage of all data.
B. The Importance of a Well-Chosen Lexicon
- Potential Pitfall
- “Music trends” might ignore non-musical audio, like popular catchphrases or voiceovers.
- Smart Choice
- “Sound-driven trends” encourages exploration of all types of audio clips—music, voice, or otherwise.
C. Iteration and Emergence
- First Cycle: Notice that audio is central to virality.
- Second Cycle: Realize it fades with repetition.
- Third Cycle: Ask new questions—can you predict which sounds will peak and fade fastest?
Each iterative loop refines the theory, much like polishing a rough diamond.
D. Real-World Impact
- For TikTok
- Could auto-suggest fresh sounds to keep viewers engaged.
- For Creators
- Rotating audio choices helps avoid annoying audiences with overplayed clips.
- For Marketers
- Invest early in viral audio campaigns before trends become stale.
1. Instagram Influencer Content Evolution
- Sampling (Jan–Mar 2024)
Select 500 top influencer posts spanning fashion, tech, and lifestyle niches. This ensures diversity in content and avoids skewing toward any single domain. - Synchronic Analysis
- Human + Computer Steps:
- Manually review a subset of posts to note recurring themes (e.g., color palette, poses).
- Use image-recognition or computer-vision tools to quantify aspects like lighting, filters, and backgrounds across all 500 posts.
- Key Finding: Roughly 65% of influencers rely on similar lighting and filtering techniques.
- Human + Computer Steps:
- Lexical Framing
- Term: “Algorithmic Aesthetic”
- Rationale: Emphasizes how platform algorithms shape and propagate particular visual styles. Using the term “algorithmic” expands beyond simple “trends,” suggesting an underlying mechanism driving these aesthetics.
- Diachronic Analysis
- Approach: Track how these visual techniques evolve or “mutate” over several months.
- Outcome: Identify the lifespan of an aesthetic (e.g., how quickly followers and influencers move on to new looks).
- Emergent Theory
“Social media content aesthetics have increasingly short lifecycles, driven by algorithmic recommendation systems.”
2. GitHub Open-Source Project Collaboration
- Sampling
Choose 500 programming repositories with high star counts, ensuring a representative mix of popular languages and project types. - Synchronic Analysis
- Human + Computer Steps:
- Examine commit logs and pull requests to spot collaboration patterns.
- Identify common coding styles or frameworks using text-mining tools on commit messages.
- Key Finding: Many successful projects share structured contribution guidelines and active issue-tracking systems.
- Human + Computer Steps:
- Lexical Framing
- Term: “Distributed Innovation Networks”
- Rationale: Captures the collective nature of development—multiple contributors innovating asynchronously from different locations.
- Diachronic Analysis
- Approach: Observe how each project’s contributor base expands or contracts over time.
- Outcome: Reveal that sustainable repositories foster collaborative environments (e.g., mentorship for newcomers, regular code reviews).
- Emergent Theory
“Open-source project success depends more on collaboration infrastructure than on individual brilliance.”
3. Academic Research Paper Citation Networks
- Sampling
Pick 500 research papers from emerging interdisciplinary fields (e.g., AI in healthcare, computational social science) to capture cross-domain influences. - Synchronic Analysis
- Human + Computer Steps:
- Construct citation maps, visually connecting which papers cite one another.
- Identify emerging clusters or “sub-communities” via network-analysis algorithms (e.g., modularity detection).
- Key Finding: Certain clusters act as “bridges,” facilitating knowledge exchange between traditionally separate disciplines.
- Human + Computer Steps:
- Lexical Framing
- Term: “Knowledge Ecosystem Mapping”
- Rationale: Suggests a holistic view of research areas as interconnected ecosystems rather than isolated silos.
- Diachronic Analysis
- Approach: Track how citation networks change over time—do once-separate clusters merge or diverge?
- Outcome: Reveal the pace at which ideas diffuse across disciplines, highlighting potential “rapid-growth” or “stagnant” zones.
- Emergent Theory
“Interdisciplinary research accelerates through strategic citation networks, not just individual breakthrough moments.”
Why These Examples Matter
Each scenario follows the same five core steps—Sampling, Synchronic Analysis, Lexical Framing, Diachronic Analysis, and Theory Building—yet applies them to distinct “trace data”: social media imagery, code repositories, and academic citations. By iterating between human interpretation and computational tools, researchers can inductively generate robust theories about evolving trends and collaborative dynamics in widely different environments.
Our goal is to take the core idea of the Grounded Theory Method— which is basically developing theories directly from data and adapting it to work with the massive amounts of digital information we have today (like social media posts and online logs). Instead of strictly following every traditional GTM rule, we’re creating new approaches that still capture GTM’s spirit but fit large-scale, computer-driven data analysis. This way, we can handle modern “trace data” in ways that stay true to GTM’s overall philosophy, even if they aren’t exactly what classic GTM guides have prescribed.
Whenever people use technology—like browsing the internet, posting on social media, or using an app—there’s a digital record of that activity called “trace data.” Think of it like footprints we leave behind whenever we walk through sand, except these footprints are online.
- Trace data are digital “footprints” or records automatically created by IT systems (for example, logs of clicks, social media posts, or sensor readings).
- They’re often not collected for research on purpose; they’re just a natural byproduct of using technology.
- Event-based and time-stamped: This data shows when something happened and can reveal how activities change over time (like a timeline of clicks or posts).
- Growing abundance: Because organizations and individuals use so many devices and apps, these digital trails are everywhere and are only increasing.
- Why it matters for researchers:
- Traditional methods (like testing a specific hypothesis) still apply.
- But because there’s so much data, researchers can also do more open-ended exploring to discover new patterns.
- Sharing a common understanding of trace data helps researchers across different fields communicate and develop better theories.
Below is a simple, everyday explanation that uses pizza and TikTok examples to show how researchers build theories from data—either manually (Grounded Theory) or with computers (Computational Theory)—and why the words they choose (“lexicon”) really matter.
Manual vs. Automated Approaches to Building Theories from Data—and Why Words Matter
Imagine you want to find out why people love pizza.
- Manual (Grounded Theory)
- You personally interview 10 friends about their pizza preferences and write down their thoughts.
- Over time, you spot patterns (e.g., people keep mentioning pineapple toppings).
- This is like handcrafting a quilt: you piece the data together carefully, catching the small details—like why pineapple is so controversial.
- Automated (Computational Theory)
- You scan 10,000 pizza reviews online using a computer program.
- The program counts keywords like “cheese,” “crust,” or “sauce.”
- This is like a robot vacuum: it quickly identifies where the most crumbs (data) are, but it can’t always explain why they’re there.
2. The Power of Words (The “Lexicon”)
- What’s a Lexicon?
It’s simply the labels or terms you use when you talk about something. - Why It Matters:
- Enable theories: If you label pineapple on pizza as a “food trend,” you’ll look for how it spreads.
- Limit theories: If you label every topping issue as “cheese-related,” you might miss people who actually care most about the crust.
3. How Theories Are Built
- Theories = Explanations
They’re like stories that connect patterns in the data (e.g., “People love pizza because it’s customizable and shareable”). - Key Steps:
- Gather data (reviews, interviews, social media posts).
- Use words (lexicon) to label patterns (“customizable,” “shareable,” “comfort food”).
- Connect the dots to form a bigger idea (“Customizable options lead to happier eaters!”).
- Starting from Scratch?
Not exactly. Researchers use existing concepts (like “comfort food”) to make sense of new observations (why pizza sales spike on game nights, etc.).
4. Real-Life Example
- Why TikTok Trends Go Viral
- Manual Approach: You watch 100 TikTok videos by hand and notice they all share a catchy sound clip.
- Automated Approach: A computer scans 1 million TikTok videos and finds that clips repeating every 5 seconds get more shares.
- Lexicon Choice: Calling it “sound-driven trends” versus “music addiction” changes how you might study it.
- Result:
- Manual: “People copy sounds they find catchy!”
- Automated: “Repetitive audio is shared 50% more.”
- Combined Theory: “Trends spread when sounds are catchy and repetitive, but people get bored when it’s overused.”
5. Why This Matters
- Manual = Depth: You learn why people do something (e.g., love pineapple) and capture nuanced feelings.
- Automated = Scale: You handle huge data sets (like 1 million pizza reviews) fast, but might miss subtle human insights.
- Lexicon = Lens: The words you pick shape what you see. Call pineapple a “crime,” and you focus on negativity; call it “bold,” and you highlight creativity.
Analogy: Think of It Like Cooking
- Manual is tasting the soup as you cook—slow and careful, but very in touch with flavor.
- Automated is setting a timer and relying on the alarm—fast and efficient, but you might miss small seasoning tweaks.
- Lexicon is naming your recipe “Grandma’s Secret Soup” vs. “Mystery Stew.” Each name points you toward different expectations and experiences.
In the end, both methods (and the words you use) help you create a better “meal”—or, in research terms, a stronger, clearer theory.
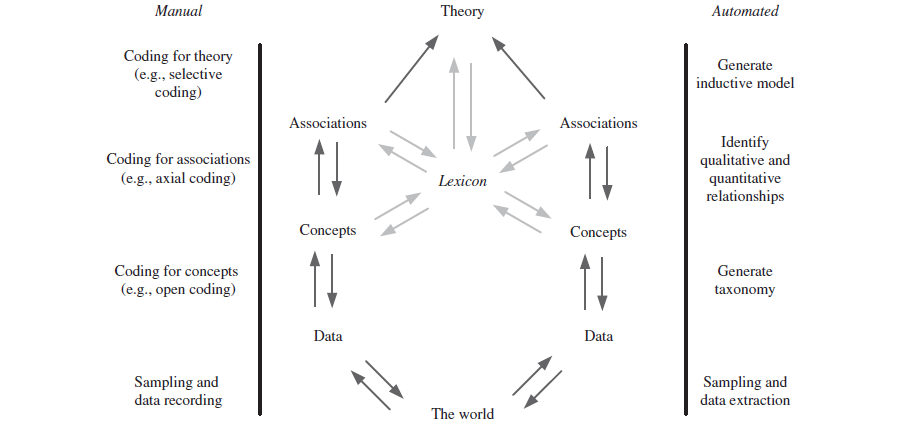
This diagram shows how both manual and automated methods can feed into an iterative process of developing theories from data, all centered around the “lexicon” (the words and concepts researchers use to make sense of what they’re seeing).
- Left side (Manual Approach):
- Researchers begin by collecting data (sampling and recording).
- Then they code the data in stages—first looking for basic ideas or “concepts,” then grouping those concepts into “associations” or relationships, and finally refining them into broader “theories.”
- Each step is largely human-driven, with the researcher interpreting the data.
- Right side (Automated Approach):
- Computers extract data automatically.
- Software might generate a taxonomy (categories of items or patterns), detect relationships in the data (qualitative or quantitative), and build inductive models (statistical or machine-learning models).
- This process is mostly algorithm-driven, although humans still decide how to set it up and interpret results.
- The Center (The Iterative Cycle):
- “The world” (the reality you’re studying) produces data.
- Those data lead to concepts (core ideas), which link to associations (how concepts relate), which in turn form or refine theories.
- The lexicon is in the middle, guiding which concepts and relationships you even notice.
- Arrows point in multiple directions, showing that you keep going around this cycle: new data might refine your concepts, which can change your associations, which might reshape your theory, and so on.
In short, the figure illustrates an ongoing loop of collecting data, labeling it, identifying patterns, and building theories, with the lexicon (your choice of words and concepts) at the heart of both manual and automated approaches.
Habermas’s Big Point About Language in Science

Imagine you’re on a basketball team. Your team uses special terms like “pick and roll” or “fast break” to communicate strategies. These words help everyone understand quickly because they’re part of your shared language. Scientists do the same—they use a shared “lexicon” (special terms) to describe their ideas in ways their research community understands.
1. How the Shared Language Helps
It’s like cooking:
- When a recipe says “sauté,” everyone knows what to do without explaining it step by step.
- Similarly, scientists use terms like “data-driven” or “hypothesis” to save time and build on what others have already done.
- Think of it like Lego blocks—you can create complex ideas faster because the building blocks are already there.
2. How It Can Limit Thinking
Using the same language over and over can sometimes trap you:
- Basketball Example: If your team only uses “pick and roll,” you might never invent a new play.
- Science Example: If researchers stick to old terms, they might miss new patterns or ideas.
It’s like trying to describe the taste of a new fruit but only knowing the words “sweet” or “sour.” You’d miss subtleties like “tangy” or “earthy.”
3. Two Ways Scientists Build Theories
Manual Method (Grounded Theory):
- What it’s like: A detective solving a mystery by gathering clues and inventing terms to explain patterns.
- Example: Watching 100 TikTok videos and coming up with the term “sound-driven trends” to describe why some go viral.
Computational Method:
- What it’s like: Using a spell-checker to quickly scan massive amounts of data.
- Example: A computer analyzing 1 million tweets and counting how often “😂” is used—but it can’t tell if people are laughing at a joke or being sarcastic.
4. Why Words Matter
- Enables: Shared terms let scientists build on each other’s work, like adding floors to a skyscraper without starting from scratch.
- Constrains: If everyone uses the same old terms, they might miss breakthroughs—like if doctors only talked about “germs” and never discovered “viruses.”
Real-Life Example: Binge-Watching
Problem: Why do people binge-watch TV shows?
- Manual Approach: Interview fans and invent the term “cliffhanger addiction” to explain the behavior.
- Computational Approach: A computer analyzes streaming data and finds “episodes watched per session.”
- Lexicon Trap: If the computer isn’t programmed to spot “cliffhangers,” it might miss the real reason people binge-watch.
TL;DR:
Scientists use shared terms (like sports or cooking terms) to make research faster and clearer. But those terms can also limit their thinking. Manual methods allow them to create new terms (like inventing a new play), while computers rely on old terms (like auto-correct). Both approaches have strengths and weaknesses—just like following a recipe vs. cooking freestyle! 🍕📚
What is Grounded Theory Methodology (GTM)?
Grounded Theory Methodology (GTM) is a way of creating new theories by closely studying real-world data. It’s been incredibly influential in helping researchers use qualitative research (like interviews, observations, or text analysis) to build theories. This method has been widely adopted in many social sciences like sociology, psychology, and business.
The key idea is: let the data guide you. Instead of starting with a big theory and testing it, you start with no assumptions, look at the data, and figure out patterns and ideas as you go.
How GTM Works
- Start with Data from the Real World:
Imagine the world as one massive data set. Grounded Theory starts by selecting a small portion of this “world” to study—this could be interviews, social media posts, or observations of people’s behavior. - Analyze the Data Closely:
- Researchers break the data down into smaller pieces (like individual words, phrases, or actions) and look for patterns or common ideas.
- For example, if you’re studying why people love gardening, you might notice themes like “relaxation,” “connection with nature,” or “health benefits.”
- Build on What You Find (Theoretical Sampling):
- After analyzing the first batch of data, researchers ask: “What else do I need to know?” They go back and collect more data to dig deeper into emerging patterns.
- For instance, if you notice people talk a lot about relaxation in gardening, you might collect more data specifically about how gardening helps them relax.
- Keep Refining:
- This process continues in cycles: gather data, analyze it, refine your ideas, and gather more targeted data. Over time, a theory emerges based on what you’ve found.
Why GTM Isn’t Just One Method
Over time, GTM has become more of a “family” of methods, meaning there are different versions of how to use it. Researchers don’t always agree on:
- How to Analyze Data: Some focus more on coding (organizing data into categories), while others prefer a looser, more interpretive approach.
- The Role of Existing Research: Some believe you should ignore prior studies at first to stay unbiased, while others think you should use existing research as a foundation.
- Underlying Philosophies: Researchers debate whether GTM is a purely objective method or whether their own perspective influences the theories they create.
The Role of Language (Lexicon)
When researchers use GTM, they rely on a “lexicon”—the words and terms they use to describe what they find in the data.
- Building a New Lexicon: As researchers analyze data, they often create new terms or concepts to explain what they see (e.g., inventing a term like “eco-anxiety” to describe stress about environmental issues).
- Using an Existing Lexicon: Researchers also rely on pre-existing ideas and terms as a starting point, which helps them make sense of what they’re seeing. For example, if studying gardening, they might borrow terms like “mindfulness” from psychology.
However, the lexicon both helps and limits them:
- Helps: It speeds up research because they don’t have to invent everything from scratch.
- Limits: Once they commit to certain terms, it might be harder to notice other patterns outside that framework.
How Sampling Works in GTM
GTM uses a special process called theoretical sampling, which is different from most other types of research sampling.
- Start Small: Researchers begin with a small sample of data (e.g., 10 interviews).
- Analyze and Adjust: After studying the first sample, they decide what’s missing or what needs more attention. This helps them decide what to sample next.
- Iterative Process: New samples are chosen based on what the researchers are learning as they go. For example, if they find that people talk about relaxation in gardening, they might sample data specifically about how gardening compares to other relaxing activities like yoga or painting.
In this way, the sample “emerges” over time as researchers refine their focus and follow where the data leads them.
Example in Everyday Terms: Imagine you want to figure out why people enjoy cooking:
- You start by talking to five friends who cook regularly and notice common themes like “creativity” and “stress relief.”
- Based on those findings, you decide to interview five more people who focus on different cuisines to see how creativity shows up in their cooking.
- Over time, you refine your understanding and create a theory: “Cooking is a creative outlet that reduces stress by providing a sense of control.”
This step-by-step process is exactly how Grounded Theory works—start small, analyze, and keep building until a clear explanation emerges.
In summary, Grounded Theory Methodology is a way for researchers to build new theories directly from real-world data. It involves carefully analyzing small samples, letting the results guide the next steps, and creating or refining the language used to explain what’s happening. It’s a flexible, creative process that allows researchers to uncover insights they might not have noticed with traditional methods.
What Is Coding in Grounded Theory?
Coding is like sorting through a big pile of messy data and organizing it into meaningful categories to uncover patterns. It’s a key part of Grounded Theory Methodology (GTM) and involves going through the data multiple times to break it down, label important parts, and eventually build a theory.
How Coding Works
- It’s an Iterative Process (You Do It in Steps):
- First Pass: Look at the data (e.g., interview transcripts, social media posts) and identify basic ideas or concepts (e.g., “stress relief” in a cooking interview).
- Second Pass: Group similar concepts into broader categories (e.g., “relaxation activities” that include cooking, yoga, and gardening).
- Third Pass: Connect the categories to each other to form a bigger picture or theory.
- It’s like solving a mystery—you keep going back to the clues, finding connections, and refining your understanding.
- It Informs Data Collection:
- Coding isn’t something you do only after collecting all the data. Instead, coding helps guide what data to collect next.
- Example: If early analysis suggests people find gardening relaxing, you might then interview more people to explore this idea further, just like a detective following new leads.
- It’s Interactive:
- Coding and data collection happen together. Each round of coding helps shape the next round of data collection, and the new data reshapes the coding.
Manual vs. Automated Coding
- Manual Coding:
- Traditionally, coding is done by hand—researchers carefully read and re-read the data to identify patterns.
- Example: A researcher might read 100 comments in an online community and manually note themes like “helpful advice” or “friendly interaction.”
- Automated Coding:
- With modern tools like machine learning and natural language processing, parts of coding can be automated. Computers can scan large datasets (like thousands of tweets) to identify common words, phrases, or patterns.
- Example: A program might find that the word “helpful” appears frequently in a discussion thread, suggesting a pattern of positive interactions.
Coding Is Not Just for Qualitative Data
- Although it’s often used for qualitative data (like interviews or text), coding can also apply to quantitative data (like numbers).
- Example: A researcher analyzing survey results might code responses into categories like “high satisfaction” or “low satisfaction” to identify trends.
The Role of Language (Lexicon)
- What’s a Pre-Theoretical Lexicon?
It’s the set of words and ideas researchers already know when they start analyzing data.
- Why It’s Helpful: It gives researchers a foundation for making sense of the data.
- Why It’s Not a Blank Slate: Researchers are influenced by their prior knowledge and experience—they don’t approach the data completely unbiased or “from scratch.”
- Example:
A researcher studying online communities might already know terms like “trolling” or “moderation.” These concepts help them notice and label patterns in the data. However, they don’t force these terms onto the data—they adjust their thinking as new patterns emerge.
How Coding Builds Theory
- Start with Data:
- Collect interviews, online posts, or observations.
- Break It Down:
- Identify small pieces of information (concepts) and then group those into bigger ideas (categories).
- Compare and Refine:
- Constantly compare the new data with the existing data and the concepts you’ve created. Adjust as new patterns emerge.
- Build the Theory:
- Use the concepts and categories to explain what’s happening and why. This explanation becomes the theory.
An Example of Coding in Action
Let’s say you’re studying why people join online fitness communities:
- You start by collecting posts from the group and reading them carefully.
- In the first round of coding, you notice common themes like “motivation,” “shared goals,” and “accountability.”
- In the next round, you group these into broader categories, such as “social support” and “personal growth.”
- These categories help you decide what to focus on next—like interviewing members to explore how social support impacts their fitness journey.
- Over time, you create a theory: “People join fitness communities to feel supported and accountable, which helps them achieve personal growth.”
Why Coding Is Essential
- It’s not just about organizing data—it’s about constantly learning from the data and letting it shape the questions you ask and the theories you develop.
- It’s an interactive process where your observations and prior knowledge (the lexicon) work together to uncover new insights.
In short, coding is like being a detective: you gather clues, organize them into meaningful patterns, and use those patterns to explain the bigger picture. It’s a creative and dynamic process that bridges raw data and meaningful theory.
What Is Manual Grounded Theory?
Manual Grounded Theory Method (GTM) is a way of creating theories by breaking down real-world data into smaller pieces, organizing those pieces into patterns, and using them to build a bigger explanation (or theory). It’s a hands-on process that involves carefully analyzing data over multiple rounds.
The 4 Key Steps in Manual GTM
- Start with Data Sampling:
- Begin by collecting a small sample of data from the real world (like interviews, social media posts, or observations).
- As you analyze this data, decide what additional data to collect to follow up on emerging ideas. This is called theoretical sampling, where you let your analysis guide what you study next.
- Identify Concepts (Coding):
- Break the data into smaller parts and label (or “code”) important ideas.
- Example: If you’re studying why people join fitness groups, you might label comments with words like “motivation,” “support,” or “goals.”
- These codes help you organize the raw data into meaningful chunks.
- Find Relationships (Pattern Matching):
- Look for connections between the concepts you identified.
- Example: You might notice that “motivation” is often linked to “social support.” This step helps you see how ideas relate to each other.
- Build a Theory:
- Use the concepts and relationships you’ve identified to create a bigger picture—a theory that explains why things happen.
- Example: “People join fitness groups because social support boosts their motivation, helping them stick to their goals.”
Why Is This Process Iterative?
- You Repeat the Steps: After analyzing the first round of data, you might collect more data to refine your concepts or test new ideas.
- Everything Evolves: The data sample, concepts, relationships, and the final theory all change and grow as you go through the process.
It’s like solving a puzzle: you don’t know the full picture at first, but each piece you add helps clarify it.
Two Ways of Analyzing Data
- Synchronic Analysis (At a Single Point in Time):
- Focus on what’s happening at a specific moment.
- Example: Analyzing comments on a fitness app during January (when people are motivated by New Year’s resolutions).
- Diachronic Analysis (Over Time):
- Look at how things change over time.
- Example: Studying how motivation in a fitness group evolves after six months of participation.
Coding Cycles in GTM
The process of coding happens in cycles, moving from detailed descriptions to more abstract ideas:
- Open Coding: Start by identifying as many concepts as possible in the data (e.g., “motivation,” “goals,” “stress relief”).
- Axial Coding: Group similar concepts into broader categories and explore their connections (e.g., “social support” linking “motivation” and “goals”).
- Selective Coding: Focus on the core ideas and how they all fit together to build a theory (e.g., “Social support drives long-term motivation in fitness groups”).
Challenges and Debates in GTM
- Researchers don’t always agree on the best way to code or analyze data, and different versions of GTM (like Straussian or Charmazian approaches) use slightly different strategies.
- However, all versions share the same four key stages:
- Collecting and sampling data.
- Identifying key concepts.
- Finding patterns and relationships.
- Building an integrated theory.
Why This Matters
The process of coding is the backbone of GTM. It’s a way of systematically making sense of messy real-world data by identifying patterns, connecting ideas, and creating a theory. While manual coding is time-intensive, it allows researchers to deeply engage with the data and uncover insights that might not be obvious at first glance.
Analogy:
Think of GTM as writing a story from scratch:
- First, you gather “raw material” (data).
- Then, you identify the characters and themes (concepts).
- Next, you figure out how the characters relate to each other (relationships).
- Finally, you weave it all into a coherent narrative (theory).
Each round of analysis helps refine the story, making it clearer and more meaningful.
What Is Automated Computational Theory Discovery (CTD)?
CTD is a process that uses computers and advanced technologies like artificial intelligence (AI) and machine learning (ML) to help researchers discover new patterns, relationships, and theories from large amounts of data. It’s a more modern and automated way to approach scientific research, especially when dealing with massive datasets.
Instead of relying solely on traditional methods (like forming a hypothesis and testing it step-by-step), CTD allows researchers to uncover insights directly from data itself, making it faster and more scalable. However, this process isn’t completely automatic—human researchers play a critical role at every stage.
How CTD Works (Step-by-Step)
- Sampling Observations from the Real World:
- Researchers begin by choosing a dataset that is relevant to the problem or question they want to explore. This data could come from a wide variety of sources, such as climate records, social media posts, or genetic data.
- Example: If you’re studying how diseases spread, you might collect data on infection rates, population density, and travel patterns.
- Human Role:
- Researchers decide which data to include based on their expertise and understanding of the problem. For example, they might focus on infection data from specific regions or time periods that are more relevant to their study.
- Generating a Taxonomy of Concepts:
- The computer analyzes the raw data and organizes it into categories or concepts (a taxonomy). These are essentially “building blocks” that help researchers make sense of the data.
- Example: In a study of customer reviews, the taxonomy might include concepts like “product quality,” “customer service,” and “delivery time.”
- Human Role:
- Researchers guide this step by defining the parameters of analysis (e.g., what counts as “product quality”). They may also refine the taxonomy if the computer misses important nuances or creates irrelevant categories.
- Identifying Relationships and Patterns Among Concepts:
- Once the taxonomy is created, the system looks for connections or patterns between the concepts. These can be both qualitative (e.g., descriptive connections like “angry customers often complain about delivery times”) and quantitative (e.g., measurable relationships like “delivery delays increase complaints by 20%”).
- Example: In a climate study, the system might find that “rising temperatures” are linked to “increased rainfall” in certain regions.
- Human Role:
- Researchers validate the relationships to ensure they are meaningful and relevant. They might also refine the analysis to focus on specific patterns that are most important to their research question.
- Building Structural and Process Models:
- Finally, the computer helps create models that explain the relationships it found. These models might show how concepts are connected or how they change over time.
- Example: A model of disease spread might show how population density and travel patterns influence infection rates, creating a predictive framework.
- Human Role:
- Researchers integrate these models with existing scientific knowledge to ensure they align with real-world observations. They also interpret the results to draw conclusions and refine their theories.
How CTD Differs from Traditional Research
- Traditional Methods: Researchers often follow a hypothetico-deductive approach, where they propose a hypothesis, test it, and adjust their thinking based on the results.
- CTD Approach: CTD takes a data-driven, inductive approach, where theories emerge directly from the data. Instead of starting with a hypothesis, researchers let the data guide them toward patterns and relationships.
Why This Matters:
CTD allows researchers to handle far larger datasets and discover patterns that might not have been noticed using traditional methods. However, it still requires human expertise to interpret the results and guide the process.
Examples of CTD in Action
- Hard Sciences (Physics, Chemistry, Genetics):
- CTD has been used to discover new chemical compounds, identify genetic relationships, and even solve mathematical problems.
- Example: In genetics, CTD systems can analyze millions of DNA sequences to find patterns linked to diseases.
- Social Sciences and Marketing:
- In marketing, CTD helps companies analyze customer behavior on a massive scale.
- Example: A CTD system might analyze millions of shopping transactions and find that people who buy baby formula are more likely to buy diapers at the same time.
- Environmental Studies:
- CTD can process climate data to uncover complex relationships between variables like temperature, rainfall, and wind patterns.
- Knowledge Discovery in Databases (KDD):
- KDD focuses on analyzing large datasets (e.g., retail sales, social media posts) and mapping low-level data to higher-level concepts.
- Example: A KDD system might turn raw transaction data into insights like “holiday sales spike for toys in December.”
Key Characteristics of CTD
- Automated But Not Fully Automatic:
- Computers do most of the heavy lifting, like processing data and finding patterns, but researchers are still essential.
- Why Humans Matter:
- They define the research question and choose the data to analyze.
- They validate the findings to ensure they’re meaningful.
- They refine and interpret the models to create a usable theory.
- Guided by Existing Knowledge:
- CTD doesn’t start from scratch. It relies on existing scientific knowledge and “lexicons” (specialized vocabularies) to guide its analysis.
- Example: A CTD system analyzing disease outbreaks uses terms like “infection rate” and “transmission” as starting points for analysis.
- Amplifies Human Research:
- CTD doesn’t replace researchers—it makes them more effective. It helps process large datasets quickly, leaving researchers more time to focus on interpretation and theory-building.
Advantages of CTD
- Scalability:
- CTD can handle massive datasets that would be impossible to analyze manually.
- Efficiency:
- It speeds up the research process, identifying patterns and relationships in hours or days instead of years.
- Broader Insights:
- By uncovering hidden patterns, CTD can reveal connections that researchers might never notice on their own.
Challenges of CTD
- Human Interaction is Critical:
- Machines can’t choose the right data to analyze or interpret the results without human guidance.
- Example: A CTD system might group unrelated data together unless researchers provide context.
- Limited by Data Quality:
- If the input data is incomplete or biased, the results will also be flawed.
- Not Great at Rare Cases:
- CTD systems struggle with situations where data is scarce or unusual. Human researchers are better at spotting these outliers.
Why CTD Matters
CTD is transforming how researchers approach scientific discovery. By combining human expertise with computational power, it allows us to tackle complex problems, analyze massive datasets, and uncover patterns and insights that were previously out of reach. However, CTD isn’t about replacing human researchers—it’s about helping them work faster, smarter, and more effectively. It’s a partnership between humans and machines, amplifying what each can do on their own.
A Simple and Detailed Explanation of a Computationally Intensive Approach to Theory Development
Introduction
This approach focuses on using a mix of manual and computational methods to develop theories from data. It combines traditional grounded theory methods, where researchers manually analyze data, with modern computational techniques that use software and algorithms to uncover patterns.
The idea is not to replace manual work with automation but to combine the strengths of both approaches to handle the massive amounts of data available today. This hybrid process—referred to as computationally intensive grounded theory development—enables researchers to generate deeper and more reliable insights.
Why Combine Manual and Computational Methods?
- In the past (like in the 1960s), grounded theory was developed entirely manually, often by writing, coding, and organizing data on paper.
- Today, researchers use tools like software for transcription, coding, and analysis, which makes manual methods more efficient.
- Similarly, computational methods like machine learning or clustering algorithms aren’t fully automated; they still require human input to guide the process and interpret results.
So, combining the two approaches lets researchers:
- Analyze Larger Data Sets that would be too overwhelming to handle manually.
- Improve Accuracy by validating patterns found computationally through human judgment.
- Save Time while still ensuring creativity and insights from manual work.
What Does a Combined Approach Look Like?
1. Starting with Sampling and Data Collection
- Manual Approach:
- Researchers might begin by conducting interviews or observing real-life activities. For example, if studying customer behavior, they might record conversations or interactions.
- Computational Approach:
- They can later expand this dataset by including digital trace data (e.g., website clicks, social media activity logs). Computational methods can help collect and organize this large-scale data.
- Example Combination:
- Start with interviews to identify key themes (manual).
- Enrich the dataset by adding web activity logs or social media data related to the same themes (computational).
2. Synchronic Analysis: Understanding Data at a Single Point in Time
- Manual Approach:
- Researchers code data (assign labels or categories) by reading through transcripts or logs and manually tagging phrases with meanings (e.g., “customer satisfaction,” “frustration”).
- Computational Approach:
- Algorithms, such as clustering or topic modeling, group similar patterns in the data. For example, AI might identify that the phrases “delivery took too long” and “package arrived late” both fall under “delivery issues.”
- Example Combination:
- Use clustering algorithms to identify broad categories from trace data (computational).
- Validate or refine these categories manually to ensure they’re meaningful and aligned with the research context.
3. Diachronic Analysis: Understanding Patterns Over Time
- Manual Approach:
- Researchers track changes in data manually. For example, they might look at how customer complaints evolve before and after a new company policy is introduced.
- Computational Approach:
- Use structural or process modeling to identify cause-and-effect relationships over time. For example, algorithms might find that increased customer dissatisfaction directly correlates with product delivery delays during a specific month.
- Example Combination:
- Use computational methods to detect long-term trends or correlations in the data.
- Manually analyze these findings to ensure they make sense and align with the broader research context.
4. Theory Development
- Manual Approach:
- Researchers build theories by combining patterns and relationships they’ve identified through coding and observations. For instance, they might propose that customer loyalty depends on consistent communication.
- Computational Approach:
- Computational models can suggest additional relationships or even test the validity of the researcher’s manually developed theories.
- Example Combination:
- Manually identify key factors influencing loyalty.
- Use computational tools to test these factors against large datasets for confirmation or refinement.
Why This Combined Approach Works
- Efficiency and Scale:
Computational methods allow researchers to process huge datasets quickly and extract patterns that manual methods might miss. - Reliability:
Manual methods validate the results by ensuring they are contextually accurate and relevant. - Creativity and Insight:
Theorizing still requires human ingenuity to make sense of the patterns and turn them into meaningful contributions to knowledge.
Iterative Nature of the Process
The steps above don’t follow a strict sequence. Instead, they are iterative, meaning researchers often go back and forth between sampling, analyzing, and theorizing. For example:
- You might identify a pattern computationally, validate it manually, and then collect additional data to explore the pattern further.
- This iterative process continues until you reach a comprehensive theory.
Example of a Combined Approach in Practice
Imagine a study on why employees resist new technologies in the workplace:
- Manual Sampling: Begin by interviewing employees to understand their concerns.
- Enrich Dataset: Use trace data (e.g., logs of how employees interact with the new technology).
- Manual Coding: Categorize interview responses (e.g., “lack of training,” “fear of job loss”).
- Computational Pattern Detection: Use clustering algorithms on interaction logs to find patterns (e.g., employees who rarely use the system tend to be in departments with less training).
- Theory Development: Combine insights to propose a theory: “Resistance to technology is higher in departments with poor training and unclear communication about benefits.”
- Manual and Computational Methods Work Together: Both are essential and complement each other. Manual work brings insight and context, while computational methods handle complexity and scale.
- Flexibility in the Process: Researchers can adapt the balance of manual and computational methods based on the needs of the study.
- Iterative Nature: The process evolves as new data and patterns emerge.
This hybrid approach is crucial for generating theories in today’s data-rich research environment, ensuring both depth and breadth in analysis.
Detailed Explanation: Sampling and Data Collection for Theory Development
Introduction
Sampling and data collection form the foundation of any research project. In this step, the researcher defines the study’s boundaries, collects an initial dataset, and refines the sampling process iteratively based on insights from the analysis. This approach blends manual methods (e.g., interviews, qualitative observations) and computational techniques (e.g., analysis of trace data from digital systems or online activities) to handle a broader range of data while maintaining a focus on context and meaning.
Purpose of Sampling and Data Collection
- Scope Definition: Clearly outline the phenomenon or area of interest (e.g., user adoption of AI tools, cybersecurity risks, or customer behavior).
- Initial Data Collection: Start with a small, manageable sample to uncover initial patterns or themes.
- Theoretical Sampling: Expand data collection iteratively based on findings from earlier samples.
- Balance Manual and Computational Methods: Use manual methods to gain depth and context while leveraging computational tools to handle large-scale datasets.
Detailed Steps for Sampling and Data Collection
1. Define the Research Area and Scope
The first step is to set the boundaries of your investigation:
- Research Questions:
- Clearly identify what you want to explore. Examples:
- “What factors influence employee resistance to new technology?”
- “How do consumers emotionally react to AI-generated content?”
- These questions define the type of data and analysis required.
- Clearly identify what you want to explore. Examples:
- Scope and Boundary Conditions:
- What to Include: Specify the data sources (e.g., interviews, trace data, social media posts).
- What to Exclude: Avoid irrelevant or overly broad data that may dilute your focus.
- Initial Dataset Selection:
- Identify a “convenient” starting dataset, such as:
- A specific subreddit (e.g., r/ArtificialIntelligence).
- Usage logs from a digital platform.
- A set of employee interviews.
- Identify a “convenient” starting dataset, such as:
2. Collect the Initial Sample
The initial dataset should be manageable and diverse enough to reveal patterns.
Manual Sampling
- Interviews:
- Conduct 5–10 interviews to gather qualitative insights.
- Example: Interview employees about their experiences with a new software system.
- Questions to Ask:
- “What challenges have you faced while using the system?”
- “What support or training have you received?”
- Observations:
- Observe user interactions or behaviors.
- Example: Watch employees as they navigate the system to identify usability issues.
Computational Sampling
- Trace Data Collection:
- Use trace data such as:
- Social Media Posts: Extract Twitter posts using hashtags like #AIAdoption or #TechResistance.
- System Logs: Collect data on system usage (e.g., login times, error logs, time spent on tasks).
- Tools:
- APIs: Use Twitter API or Reddit API to collect relevant posts.
- Web Scraping: Use Python libraries like BeautifulSoup or Scrapy to extract online discussions.
- Use trace data such as:
- Metadata Collection:
- Capture engagement metrics like:
- For social media: Likes, retweets, comments.
- For system logs: Time spent, frequency of use, error rates.
- Capture engagement metrics like:
Example Combination of Manual and Computational Sampling
- Start with 5 employee interviews to understand challenges with a new system (manual).
- Expand by collecting system usage logs for all employees to validate and scale up findings (computational).
3. Analyze the Initial Sample
Once the initial data is collected, begin analyzing it for early insights.
Manual Analysis
- Qualitative Coding:
- Read through the interviews or observations.
- Identify common themes or categories.
- Example: You might notice recurring mentions of “lack of training” or “confusing interface.”
- Contextual Understanding:
- Pay attention to nuances and specific details in the data.
- Example: An employee might say, “I avoid the system because it always crashes when I use it,” revealing a technical issue.
Computational Analysis
- Data Preprocessing:
- Clean and standardize trace data.
- Example: Remove irrelevant hashtags or duplicate social media posts.
- Pattern Detection:
- Use clustering or topic modeling to group data into themes.
- Example: Algorithms might identify that “lack of support” is a recurring topic in social media posts.
Combining Insights
- Manual Insights: Provide depth and context (e.g., why employees are frustrated).
- Computational Insights: Offer scale and breadth (e.g., how many users share similar frustrations).
4. Refine the Sampling Process (Theoretical Sampling)
Based on your initial analysis, decide what additional data you need. This iterative process, known as theoretical sampling, ensures that you collect data purposefully to deepen and broaden your understanding.
Guided Sampling:
- Manual Sampling:
- Focus on participants or contexts revealed to be significant in the initial analysis.
- Example: If “training issues” emerge as a theme, interview employees who completed vs. skipped training.
- Computational Sampling:
- Expand datasets based on emerging themes.
- Example: If social media posts reveal frustration with AI systems, collect more posts from specific subreddits or time periods.
Mixed Sampling:
- Combine different data types for richer analysis.
- Example: Analyze interviews to identify specific issues and validate these findings by examining system logs.
5. Zoom In and Zoom Out
To develop a robust understanding, alternate between detailed analysis of specific elements and broader pattern identification.
Zoom In (Contextual Detail):
- Examine specific cases or instances in depth.
- Example: Analyze an interview to understand why an employee finds a system frustrating.
Zoom Out (Broader Patterns):
- Use computational tools to look at trends or patterns across the dataset.
- Example: Identify that employees in certain departments have higher error rates based on system logs.
6. Iterate Until Saturation
- Continue sampling and analyzing data until new insights stop emerging (data saturation).
- Example:
- After analyzing 30 interviews and thousands of system logs, you notice no new themes beyond “lack of training” and “technical glitches.”
Key Considerations
- Balance Data Size:
- Avoid collecting too much data initially to prevent being overwhelmed. Add more data only as needed to explore emerging patterns.
- Ethical Concerns:
- Anonymize trace data and ensure compliance with data protection regulations (e.g., GDPR).
- Complementary Data Types:
- Combine qualitative (e.g., interviews) and quantitative (e.g., system logs) data to strengthen findings.
Example: Sampling for AI Adoption Study
- Define the Scope:
- Study employees’ resistance to AI-based tools in a workplace.
- Initial Sampling:
- Conduct 10 interviews with employees to understand initial reactions.
- Collect system usage logs to analyze how often employees use the tool.
- Refine Sampling:
- Focus on employees who rarely use the tool and compare their behavior to frequent users.
- Zoom In and Out:
- Zoom in on specific interview responses (e.g., “I stopped using it because it made errors”).
- Zoom out by analyzing logs to see if similar usage patterns exist across departments.
The sampling and data collection process is iterative, starting with a manageable dataset and refining it based on insights. By combining manual methods (e.g., interviews) with computational techniques (e.g., trace data analysis), researchers can achieve a balance of depth and breadth, leading to a more comprehensive and accurate theory development process.
What is Synchronic Analysis?
Synchronic analysis is the process of examining data at a single point in time to uncover patterns, categories, and relationships. It focuses on identifying recurring concepts (themes) and their associations (how they connect to one another). This process can be done manually or computationally, and the goal is to discover regularities in the data that help build a theory.
How Synchronic Analysis Works
Manual Approach (Grounded Theory)
In manual grounded theory:
- Coding for Concepts:
- Researchers identify categories (concepts) by grouping similar pieces of data.
- Example:
- In interviews about employee resistance to AI tools, phrases like “confusing interface” and “hard to use” might be grouped under the category “Usability Issues.”
- Associations Between Concepts:
- After creating categories, researchers look for relationships between them.
- Example:
- If “Usability Issues” frequently co-occurs with “Frustration,” a connection between the two categories is noted.
- Open and Axial Coding:
- Open Coding: Identify and label broad categories based on similarities in the data.
- Example: Group all employee complaints about a system’s training materials into a category called “Training Deficiency.”
- Axial Coding: Explore connections between categories and subcategories.
- Example: If “Training Deficiency” co-occurs with “Low System Usage,” the researcher examines how inadequate training impacts system adoption.
- Open Coding: Identify and label broad categories based on similarities in the data.
Computational Approach (Using Trace Data)
In computational synchronic analysis, the process is similar, but algorithms are used to identify categories and associations:
- Developing a Taxonomy (Categories):
- Algorithms group similar pieces of data into clusters, effectively creating categories.
- Example:
- A clustering algorithm might analyze system logs and group users into categories like “Frequent Users,” “Occasional Users,” and “Non-Users.”
- Finding Relationships (Associations):
- Computational techniques analyze how categories relate to each other.
- Example:
- An algorithm might find that “Frequent Users” tend to access help resources more often, revealing a relationship between usage frequency and support-seeking behavior.
- Clustering Techniques:
- Clustering: Observations (data points) are grouped based on similarity (e.g., text similarity, behavioral patterns).
- Example:
- Trace data from social media posts might be clustered into themes like “Positive Feedback,” “Negative Feedback,” and “Neutral Discussion.”
- Handling Complexity:
- Computational methods address the challenge of dealing with an enormous number of possible relationships in large datasets.
- These methods focus on finding relationships that are both simple and easy to interpret.
Combining Manual and Computational Approaches
The best results often come from blending manual and computational methods:
- Manual Input: Researchers bring context and interpretive skills to identify subtle or nuanced themes.
- Computational Efficiency: Algorithms handle large-scale data quickly, finding broad patterns that might be missed manually.
Example Workflow:
- Start with Manual Coding:
- Interview employees to identify initial categories like “Usability Issues” or “Frustration.”
- Add Computational Clustering:
- Analyze system logs or survey data using clustering algorithms to validate or expand these categories.
- Iterate:
- Go back and forth between manual insights and computational results to refine categories and relationships.
Key Activities in Synchronic Analysis
1. Identifying Categories
- Group similar data points (e.g., text from interviews, logs of user behavior) into meaningful categories.
- Manual Example: Reading interview transcripts and grouping complaints about training under “Training Deficiency.”
- Computational Example: Using clustering algorithms to group social media posts about a brand into themes like “Positive Sentiment,” “Negative Sentiment,” and “Suggestions.”
2. Identifying Associations
- Explore how categories are connected or co-occur.
- Manual Example: If “Training Deficiency” co-occurs with “Low System Usage” in interviews, it suggests a potential relationship.
- Computational Example: Algorithms might find that employees flagged as “Non-Users” in system logs also have low engagement with training materials.
3. Developing Synchronic Regularities
- Identify recurring patterns in the data.
- Example: Observing that “Frustration” always co-occurs with “Usability Issues” at a high rate can point to a regular association between these two categories.
4. Using Clustering Techniques
- Goal: Group data into clusters based on similarity.
- Tools: Algorithms like K-Means, DBSCAN, or Hierarchical Clustering.
- Example: Clustering customer reviews on an e-commerce platform to identify common themes (e.g., “Delivery Issues,” “Product Quality”).
5. Simplifying Relationships
- Computational methods help reduce complexity by focusing on the most relevant patterns and associations.
- Example: Instead of identifying thousands of potential connections in a dataset, computational tools might highlight the top 10 most significant relationships.
Challenges in Synchronic Analysis
- Manual Analysis:
- Time-intensive and subject to researcher bias.
- Example: A researcher might overlook subtle connections between categories.
- Computational Analysis:
- Algorithms can generate too many relationships, making it hard to interpret results.
- Example: A clustering algorithm might group data points in ways that don’t make sense without human input.
Example of Synchronic Analysis in Practice
Research Context: Studying employee resistance to a new technology.
- Manual Coding:
- Interview transcripts reveal categories like “Training Deficiency,” “Frustration,” and “Usability Issues.”
- Computational Clustering:
- System logs are analyzed, and employees are grouped into clusters based on system usage patterns.
- Example Clusters: “Frequent Users,” “Occasional Users,” “Non-Users.”
- Identifying Associations:
- Combine insights:
- Manual: Employees mention frustration due to “Training Deficiency.”
- Computational: “Non-Users” cluster overlaps with employees who didn’t complete training modules.
- Combine insights:
- Emerging Regularities:
- Training deficiencies are linked to frustration, leading to low system usage.
What is Lexical Framing?
Lexical framing is the process researchers use to decide which “language” or set of terms (a lexicon) they’ll use to make sense of their data. This isn’t just about word choice—it’s about selecting a framework or “grammar” that gives meaning to the categories and codes researchers use in their analysis. The chosen lexicon shapes how data is interpreted, influencing the theories that emerge.
Why is Lexical Framing Important?
- Provides Structure: A lexicon helps organize raw data into meaningful categories.
- Guides Interpretation: The chosen terms or frameworks determine what researchers focus on and how they interpret relationships.
- Balances Flexibility: Researchers can switch between lexicons (or use multiple lexicons) to ensure they capture all relevant aspects of the data.
- Combines Abstraction and Specificity: A researcher might use broad, abstract frameworks (e.g., “actions,” “outcomes”) while also incorporating specific classification schemes tailored to their dataset.
How Lexical Framing Works
1. Pre-Theoretical Lexicon
- A pre-theoretical lexicon refers to a set of terms or concepts that researchers adopt as a starting point for analyzing their data.
- Example:
- In studying employee resistance to technology, a researcher might start with general categories like:
- Conditions: Factors leading to resistance (e.g., lack of training).
- Actions/Interactions: Observable behaviors (e.g., refusal to use new tools).
- Consequences: Results of resistance (e.g., decreased productivity).
- In studying employee resistance to technology, a researcher might start with general categories like:
2. Iterative Process
- Iterate and Refine:
- As researchers analyze data and uncover new patterns, they may refine their lexicon to better fit the emerging themes.
- Example:
- Initially, the researcher uses “training issues” as a category but later refines it to “insufficient technical training” and “poor onboarding.”
- Switching Lexicons:
- Researchers may experiment with different lexicons to see which framework works best for their data.
- Example:
- Start with a theoretical lexicon focused on “behavioral responses.”
- Switch to one emphasizing “emotional reactions” if emotional cues (e.g., frustration, fear) dominate the data.
3. Combining Levels of Abstraction
- Abstract Frameworks:
- Broad, overarching concepts like “conditions,” “interactions,” and “outcomes” provide a high-level view of the data.
- Example:
- The researcher categorizes all resistance behaviors under “interactions.”
- Specific Frameworks:
- Detailed classification schemes (e.g., using labeled datasets to train algorithms) allow for precise categorization.
- Example:
- Using AI, the researcher categorizes interactions into subcategories like “verbal complaints” and “system usage logs.”
Incorporating Computational Tools
1. Conceptual Clustering
- What it Does:
- Groups data points based on known attributes (e.g., prior knowledge) rather than just patterns in the raw data.
- Mimics how humans learn concepts by applying existing knowledge to new information.
- Example:
- In analyzing social media reactions to AI-generated content, the researcher might:
- Use an AI algorithm to cluster posts into categories like “positive sentiment” and “negative sentiment.”
- Supervise the algorithm to refine clusters based on theoretical knowledge, such as distinguishing between “fear of AI” and “distrust of AI.”
- In analyzing social media reactions to AI-generated content, the researcher might:
2. Combining Techniques
- Researchers can mix unsupervised clustering (e.g., raw data patterns) with conceptual clustering (e.g., predefined categories based on prior knowledge).
- Example:
- First, let the algorithm identify clusters of customer feedback on AI tools.
- Then, refine these clusters using a framework focused on customer concerns like “privacy,” “accuracy,” and “usability.”
Steps in Lexical Framing
Step 1: Select a Starting Lexicon
- Choose a set of terms or frameworks relevant to the research area.
- Example:
- In studying employee resistance, start with categories like “frustration,” “training deficiency,” and “usability issues.”
Step 2: Code the Data
- Apply the lexicon to the dataset through manual or computational coding.
- Example:
- Tag interview quotes like “The software keeps crashing” as “usability issues.”
Step 3: Refine Through Iteration
- Adjust or expand the lexicon as new insights emerge from the data.
- Example:
- If “usability issues” becomes too broad, split it into subcategories like “technical glitches” and “interface confusion.”
Step 4: Combine Abstract and Specific Lexicons
- Use abstract categories to provide a broad structure while incorporating specific terms for detailed analysis.
- Example:
- Abstract Category: “Outcomes.”
- Specific Subcategories: “Reduced productivity,” “High error rates.”
Step 5: Integrate Computational Techniques
- Use clustering algorithms to identify patterns and validate or refine the lexicon.
- Example:
- An algorithm identifies frequently used phrases in customer reviews, which you use to create new categories like “positive feedback” or “reliability concerns.”
Example: Lexical Framing in Action
Research Topic: Social media reactions to AI-generated art.
- Initial Lexicon:
- Start with categories like “amazement,” “fear,” “criticism,” and “neutral.”
- Manual Coding:
- Tag posts manually:
- “This is so creative!” → “Amazement.”
- “This will replace real artists!” → “Fear.”
- “AI art lacks originality.” → “Criticism.”
- Tag posts manually:
- Computational Clustering:
- Use algorithms to find patterns in sentiment.
- Example:
- Posts frequently mentioning “creativity” are grouped under “positive reactions.”
- Refinement:
- Adjust categories based on insights:
- Split “fear” into “fear of job loss” and “fear of technology.”
- Adjust categories based on insights:
- Final Lexicon:
- Combine abstract categories like “positive,” “negative,” and “neutral” with specific subcategories like “amazement,” “fear of job loss,” and “criticism of originality.”
Key Takeaways
- Flexibility: Lexical framing is not rigid; researchers can adapt their lexicon based on emerging insights.
- Iterative Process: Refining the lexicon is a continuous process throughout the analysis.
- Combination of Levels: Use broad frameworks for structure and detailed categories for precision.
- Integration with AI: Computational techniques like clustering can support and enhance manual analysis.
Lexical framing allows researchers to systematically analyze data, balancing human creativity and computational efficiency to uncover meaningful patterns and relationships.
What is Diachronic Analysis?
Diachronic analysis examines data over time to uncover patterns, sequences, and relationships. It focuses on how things change, evolve, or influence one another over time, aiming to identify causal relationships or processes that help explain the observed phenomena. This temporal perspective is essential in theory development because understanding “what happens and why” often requires seeing how events unfold in sequence.
Why is Diachronic Analysis Important?
- Incorporates Time: Theories often rely on understanding how actions or events evolve and interact over time.
- Identifies Cause and Effect: Temporal analysis helps distinguish which factors lead to others (e.g., training deficiencies lead to system adoption failures).
- Highlights Processes: Beyond static relationships, diachronic analysis examines processes and sequences (e.g., how phases of change in an organization unfold).
How Diachronic Analysis Works
1. Manual Diachronic Analysis
Manual methods in grounded theory rely on techniques like axial coding and selective coding to explore time-ordered relationships.
- Axial Coding:
- Relate concepts and categories to understand cause-effect relationships.
- Example:
- In studying employee adoption of new software:
- Category: “Training Deficiency” (cause).
- Category: “Low System Usage” (effect).
- In studying employee adoption of new software:
- Axial coding links these concepts to show that inadequate training leads to lower system adoption.
- Selective Coding:
- Integrate multiple cause-effect relationships around a core category.
- Example:
- The core category might be “Factors Influencing System Adoption,” linking training, usability, and management support into a unified framework.
2. Computational Diachronic Analysis
Computational methods leverage algorithms and models to identify temporal patterns and causal relationships in large datasets.
- Structural Models:
- Represent relationships as rules, equations, or statistical models.
- Example:
- A model might show that for every additional hour of training, system adoption increases by 15%.
- Process Models:
- Focus on time-dependent relationships and sequences.
- Example:
- A process model might reveal that employees first explore new features, then face usability challenges, and eventually stop using the software.
- Temporal Bracketing:
- Divide time into distinct phases and analyze how actions in one phase influence the next.
- Example:
- Phase 1: Training rollout → Phase 2: Early adoption → Phase 3: Resistance due to technical issues.
Key Steps in Diachronic Analysis
Step 1: Identify Time-Ordered Data
- Start with a dataset that includes timestamps or sequences (e.g., system logs, social media activity, historical records).
- Example:
- Employee login records showing when each employee accessed the system over time.
- Social media posts about an AI-generated art tool, ordered by date.
Step 2: Explore Temporal Relationships
- Look for patterns in how concepts or events evolve over time.
- Example:
- Training sessions (cause) happen before significant increases in system usage (effect).
- Negative feedback spikes on social media after a major AI feature update.
Step 3: Use Axial Coding (Manual Approach)
- Identify cause-effect relationships through qualitative analysis.
- Example:
- Interviews reveal that employees feel “frustration” (effect) due to “poor onboarding” (cause), and this pattern repeats over time.
Step 4: Apply Computational Techniques
Use computational models to identify and validate temporal patterns in large datasets:
- Process Mining:
- Extract and map sequences of actions from trace data.
- Example:
- Analyze system logs to show that employees who complete training modules in Week 1 tend to use advanced features by Week 3.
- Social Network Analysis:
- Understand how past events influence future events in networks.
- Example:
- Analyze how early adopters of a tool influence others in their department.
Step 5: Integrate Context
- Combine the identified patterns with contextual information to build a theory.
- Example:
- Social media posts show that customer dissatisfaction increases when AI-generated content quality declines. Combine this insight with survey responses to understand the reasons behind the dissatisfaction.
Step 6: Iterate and Validate
- Revisit the data multiple times to refine patterns and ensure findings align with the broader theoretical framework.
- Example:
- Use additional employee interviews or more system logs to confirm that training improvements consistently lead to higher adoption rates.
Challenges in Diachronic Analysis
- Temporal Ambiguity:
- Just because events happen in sequence doesn’t mean one causes the other.
- Example:
- High system usage after training could result from factors unrelated to training (e.g., management mandates).
- Reconstructing Context:
- Trace data (e.g., logs) often lacks the broader context needed for interpretation.
- Example:
- Login records show that an employee stopped using the system, but don’t explain why.
- Data Volume:
- Longitudinal data can span years, making manual analysis overwhelming.
- Example:
- A decade of social media posts might require computational tools to process.
Example of Diachronic Analysis in Practice
Research Context: Understanding how employees adopt a new AI system over time.
- Initial Data Collection:
- Gather system usage logs (e.g., login timestamps, feature usage).
- Conduct interviews to understand employee experiences.
- Temporal Bracketing:
- Divide the adoption process into phases:
- Phase 1: Training and onboarding.
- Phase 2: Early system exploration.
- Phase 3: Resistance or regular use.
- Divide the adoption process into phases:
- Manual Axial Coding:
- Interviews reveal:
- Cause: Poor training materials → Effect: Frustration.
- Cause: Positive peer influence → Effect: Increased adoption.
- Interviews reveal:
- Process Mining:
- Use algorithms to map the sequence of actions:
- Step 1: Log in → Step 2: Access help resources → Step 3: Use advanced features.
- Identify bottlenecks (e.g., employees stop after accessing help resources).
- Use algorithms to map the sequence of actions:
- Structural Models:
- Build a predictive model to test relationships:
- Training hours → Probability of continued usage.
- Build a predictive model to test relationships:
- Integrate Context:
- Combine trace data findings with interview insights to explain why certain phases succeed or fail.
- Diachronic analysis is critical for understanding “what happens over time” and identifying causal relationships or processes.
- Manual Approaches: Use axial and selective coding to relate concepts and build integrated theories.
- Computational Approaches: Leverage process mining and structural models to analyze large-scale temporal data.
- Challenges: Interpret temporal patterns carefully to avoid oversimplified conclusions.
- Iterative Process: Revisit data and refine insights to build a robust theory.
This method allows researchers to uncover how actions or events unfold over time, revealing patterns and processes critical for theory development.
Illustrations of Computationally Intensive Theory Development in Information Systems
This section details three studies that successfully applied computationally intensive approaches to theory development. These examples demonstrate how combining manual and computational methods can uncover insights that would be difficult to achieve with traditional methods alone. Here’s a clear and accessible breakdown of each study and its findings:
1. Miranda et al. (2015): Diffusion of IT Innovations through Organizing Visions
Research Objective:
To understand how “organizing visions”—shared ideas about implementing IT innovations—affect the spread of IT innovations in companies.
What They Did:
- Research Question:
- How do different facets of organizing visions influence IT innovation diffusion in organizations?
- Data Collection:
- The researchers collected data from:
- Fortune 50 Companies: Initial sample included text from social media, product descriptions, and media outlets.
- Size of the Dataset: The first stage yielded 2,414 text documents.
- The researchers collected data from:
- Analysis Process:
- Stage 1: Identifying Schemas
- Researchers manually analyzed the texts to extract mental schemas (shared ideas or patterns in the texts).
- Applied a framework called the “orders of worth” lexicon, which includes six principles:
- Civic, Domestic, Industrial, Inspirational, Market, and Renown.
- These principles served as dimensions to categorize the texts.
- Stage 2: Refining the Sample
- Focused on a longitudinal dataset of 1,183 IT initiatives found through manual analysis.
- Automated content analysis was used to scale up the coding process.
- Clustering:
- Used relational class analysis to group organizing visions into four clusters (schemas):
- Efficiency-Engineer: Focused on process optimization.
- Brand-Promoter: Highlighted reputation and market appeal.
- Good-Citizen: Focused on corporate responsibility.
- Master-of-Ceremonies: Focused on orchestrating and managing multiple aspects.
- Used relational class analysis to group organizing visions into four clusters (schemas):
- Exploring Variations:
- Analyzed schema facets over time: coherence, continuity, clarity, and diversity.
- Used scatterplots to identify linear and quadratic relationships between schemas and IT diffusion rates.
- Stage 1: Identifying Schemas
- Key Findings:
- Organizing visions are hierarchical structures, and different facets (coherence, clarity, etc.) influence IT diffusion in varying ways.
- Some relationships were linear (e.g., coherence improves diffusion), while others were quadratic (e.g., too much diversity can hinder diffusion).
Why It Matters:
This research provides a framework for understanding how shared visions within organizations impact the adoption of IT innovations. By automating the analysis, the researchers were able to handle a large dataset and uncover patterns that would have been impossible to find manually.
2. Lindberg et al. (2016): Coordinating Complex Work in Open-Source Communities
Research Objective:
To explore how developers in an open-source software community (Rubinius) coordinate complex work, particularly when they face unresolved interdependencies (tasks that depend on other tasks or individuals).
What They Did:
- Research Question:
- How do open-source developers coordinate their efforts when faced with interdependencies in their work?
- Data Collection:
- Collected 686 pull requests (work contributions) over 12 months from the Rubinius open-source project on GitHub.
- This included 3,704 timestamped activities such as “opened,” “commented,” “merged,” and “referenced.”
- Analysis Process:
- Stage 1: Computational Analysis
- Used sequence analysis to study how different activities were performed and their timing.
- Categorized pull requests based on their complexity using computational clustering techniques.
- Defined complexity in terms of “unresolved interdependencies” and variations in developer routines.
- Stage 2: Manual Coding
- Manually analyzed a subset of 432 text excerpts from complex pull requests.
- Created codes for developer actions, such as:
- Diagnosing, asking for clarification, providing tests, increasing code functionality, and teaching.
- Stage 3: Combining Methods
- Combined computational findings with manual insights to characterize the routines developers used to address interdependencies.
- Stage 1: Computational Analysis
- Key Findings:
- Developers manage interdependencies through two mechanisms:
- Knowledge Integration: Sharing and applying knowledge collaboratively.
- Direct Implementation: Acting to resolve specific issues.
- Complexity in pull requests is tied to variations in developer routines and interdependencies.
- Developers manage interdependencies through two mechanisms:
Why It Matters:
This study provides insights into how decentralized teams (like open-source developers) manage complex, interdependent tasks. By combining computational and manual methods, the researchers identified nuanced coordination mechanisms that go beyond traditional models.
3. Vaast et al. (2017): Connective Action on Social Media
Research Objective:
To understand how social media enables new forms of collective engagement, focusing on “connective action” during the Deepwater Horizon oil spill crisis.
What They Did:
- Research Question:
- How does social media support decentralized forms of organizing and collective action during crises?
- Data Collection:
- Sampled 23,000 tweets related to the Deepwater Horizon oil spill in April 2010.
- Focused on how Twitter facilitated collective engagement.
- Analysis Process:
- Stage 1: Manual Coding
- Identified three key “Connective Action Episodes” (CAEs) based on initial coding:
- Boycott BP: Advocating against buying BP products.
- Stop the Drill: Opposing offshore drilling.
- Hair and Fur: Using hair and fur to absorb spilled oil.
- Identified three key “Connective Action Episodes” (CAEs) based on initial coding:
- Stage 2: Refined Sampling
- Tracked all tweets related to these CAEs for further analysis.
- Stage 3: Clustering and Role Categories
- Used the DBSCAN clustering algorithm to identify role categories based on user behavior (e.g., posting frequency, retweets).
- Roles included “organizers,” “amplifiers,” and “participants.”
- Stage 4: Temporal and Network Analysis
- Used time-series analysis to map activity patterns over time.
- Conducted social network motif analysis to understand how different roles interacted within each CAE.
- Stage 1: Manual Coding
- Key Findings:
- Connective Affordances: Social media enables decentralized forms of collective engagement by allowing individuals to act independently while contributing to a shared goal.
- Identified how different roles (e.g., organizers vs. amplifiers) contributed to the success of collective actions.
Why It Matters:
This study highlights the power of social media in enabling large-scale, decentralized collective action. The combination of manual and computational techniques allowed the researchers to analyze complex networks of interactions effectively.
Key Lessons from All Three Studies
- Combining Manual and Computational Methods:
- Manual methods provided depth and contextual understanding (e.g., coding tweets or pull request descriptions).
- Computational methods scaled up the analysis, allowing researchers to process and analyze large datasets efficiently.
- Iterative and Emergent Processes:
- All three studies emphasized the importance of iterating between sampling and analysis.
- Researchers continuously refined their methods based on emerging findings.
- Challenges:
- Defining appropriate theoretical frameworks (lexicons) was a recurring challenge.
- The process required creativity, as no rigid guidelines existed for combining methods.
- Value of Computational Tools:
- Tools like clustering algorithms and network analysis allowed researchers to uncover patterns and relationships that would have been difficult to identify manually.
Why These Studies Matter
These examples illustrate how modern research methods can leverage computational tools to tackle complex, large-scale problems while retaining the depth and nuance of traditional qualitative methods. They demonstrate the versatility and effectiveness of computationally intensive approaches in advancing theory development.
Discussion and Implications: Pioneering Computationally Intensive Theory Development
The Current Dilemma in Theory Development
Locke (2007) highlights a critical issue in social science research: the rigid emphasis on hypothetico-deductive methods—starting with a theory, testing hypotheses, and then revising the theory. While this approach is widely accepted, in practice it often leads to premature theorizing or researchers retrofitting their findings to suit an initial hypothesis. This tendency stifles creativity and overlooks the real, often messy, process of discovering patterns inductively from data.
In today’s data-rich environment, where trace data (digital records of activities) is abundant, researchers should embrace inductive theory generation—exploring patterns in data to develop theories—without the stigma of “fishing” for insights or making post hoc justifications. By being honest about the inductive nature of their work and leveraging computational tools, researchers can uncover novel insights and robust theories.
Grounded Theory Methodology (GTM) as a Foundation
For decades, GTM has provided a structured approach for inductively developing theories through deep engagement with empirical data. By iteratively sampling and analyzing data, researchers have been able to generate novel concepts and relationships grounded in real-world observations.
However, with the data explosion and the availability of trace data, traditional GTM methods need to evolve. This calls for a broader grounded paradigm—one that integrates manual methods with computationally intensive approaches to maximize the potential of large datasets.
Key Elements of the Broader Grounded Paradigm
The broader grounded paradigm is characterized by two foundational elements:
- Grounded: Intense attention to empirical data through iterative sampling and analysis using qualitative, quantitative, and computational techniques.
- Theory: The identification of patterns and associations in the data, enabling researchers to construct meaningful explanations of phenomena by drawing on and extending existing theoretical lexicons.
This approach builds on the principles of GTM while incorporating computational tools to handle the scale and complexity of trace data.
The Role of Lexicons in Theory Development
A lexicon—a shared set of terms and concepts within a research community—is crucial in this process. It provides a starting point for sensemaking and ensures that new theories are connected to existing knowledge. The lexicon allows researchers to:
- Attribute meaning to observed patterns.
- Frame their findings in a way that is understandable and relevant to their academic community.
- Extend the shared vocabulary of their field, contributing to cumulative knowledge.
In the computational context, the lexicon also bridges the gap between raw data patterns and theoretical insights. Patterns identified through computational techniques (e.g., clustering or network analysis) serve as pre-theoretical foundations for new theorizing.
Illustrating the Paradigm Through Examples
Three studies exemplify how computationally intensive approaches can enhance theory development:
1. Miranda et al. (2015): Diffusion of IT Innovations
- Objective: To understand how organizing visions influence the spread of IT innovations.
- Methodology: Combined manual content analysis with automated supervised content analysis to process over 2,400 text documents and longitudinal data from Fortune 50 companies.
- Findings: Identified four organizing schemas (e.g., Efficiency-Engineer, Brand-Promoter) and showed how their coherence, clarity, and diversity influenced IT innovation diffusion.
- Implication: Demonstrates how computational tools can automate tedious coding tasks, enabling researchers to analyze large datasets efficiently while retaining theoretical depth.
2. Lindberg et al. (2016): Coordinating Complex Work in Open-Source Communities
- Objective: To explore how developers coordinate work in the absence of traditional hierarchical mechanisms.
- Methodology: Combined computational sequence analysis of GitHub pull requests (686 pull requests, 3,704 activities) with manual coding of text descriptions.
- Findings: Identified two key coordination mechanisms—knowledge integration and direct implementation—that help developers resolve interdependencies.
- Implication: Highlights how computational and manual methods complement each other, with computational tools uncovering broad patterns and manual analysis providing rich contextual insights.
3. Vaast et al. (2017): Connective Action on Social Media
- Objective: To study how social media enables decentralized collective action during crises, using the Deepwater Horizon oil spill as a case study.
- Methodology: Combined manual coding of 23,000 tweets with clustering, network motif analysis, and time-series analysis.
- Findings: Identified new forms of collective engagement (“connective action”) and explained how social media affordances facilitate decentralized organizing.
- Implication: Demonstrates how computational techniques can scale up the analysis of large, complex networks while retaining the depth of manual interpretation.
Challenges in Applying Computational Approaches
The studies highlighted several challenges in adopting computationally intensive methods:
- Defining the Lexicon:
- Researchers must align their analysis with a theoretical framework that connects findings to existing knowledge.
- Example: Using the “orders of worth” lexicon in Miranda et al.’s study to categorize organizing visions.
- Iterative and Emergent Processes:
- Theory development is not linear; it requires continuous refinement of data collection, analysis, and interpretation.
- Example: Vaast et al. refined their sampling to focus on specific action episodes (e.g., Boycott BP) based on initial findings.
- Visualization and Sensemaking:
- Computational methods often produce complex visualizations that require human interpretation to extract meaningful insights.
- Example: Lindberg et al. used visual summaries of developer activities to understand coordination mechanisms.
- Integration of Manual and Computational Methods:
- Both approaches are complementary, but researchers must creatively combine them to address research questions effectively.
The Way Forward: A Methodological Revolution
The field of information systems is uniquely positioned to lead a methodological revolution in computationally intensive social research. The abundance of trace data—enabled by the sociotechnical systems that information systems scholars study—provides unprecedented opportunities for theory development.
Key Recommendations:
- Embrace Inductive Approaches:
- Move beyond the stigma of inductive theory generation and openly adopt computational tools to explore patterns in data.
- Leverage Trace Data:
- Use the widespread availability of digital trace data to study complex sociotechnical interactions at scale.
- Combine Methods:
- Integrate manual sensemaking with computational techniques to balance depth and efficiency in theory development.
- Develop New Tools:
- Invest in methodological advancements, such as new R packages or machine learning algorithms, to enhance the capabilities of researchers.
Conclusion: A Call to Action
The abundance of trace data presents a unique opportunity for social science researchers to rethink traditional approaches to theory development. By combining the strengths of GTM and computational techniques, information systems scholars can develop novel, robust theories that advance our understanding of complex sociotechnical phenomena.
As Levina (2015) notes, we must integrate inductive data scientists into the grounded theory community and embrace computational tools to unlock the full potential of trace data. This isn’t just about improving research efficiency; it’s about creating a new paradigm for theory development that capitalizes on the unique opportunities of our data-rich era.
Information systems scholars are particularly well-equipped to lead this revolution, tackling questions that lie at the intersection of the social and the technical. With the right tools, frameworks, and mindset, this field can contribute groundbreaking insights and methodologies that reshape social science research.


Leave a Reply