


By Professor Nick Allum | Expanded and Simplified
What is Structural Equation Modeling (SEM)?
Structural Equation Modeling (SEM) is an advanced statistical methodology designed to analyze complex relationships among multiple variables simultaneously. It is particularly useful in diverse fields like sociology, psychology, political science, economics, and even extends to natural sciences such as neuroscience and physics. SEM uniquely integrates multiple analytical methods, primarily regression analysis and factor analysis, allowing researchers to rigorously test detailed theories and explore the intricate interdependencies that exist within data. The technique empowers scientists and researchers to derive deeper insights and robust conclusions about how various aspects of social and natural phenomena interact and influence one another.
Core Concepts of SEM
1. Latent Variables
At the heart of SEM are latent variables—these are theoretical constructs or factors not directly observable but inferred from measurable indicators. Latent variables represent underlying, unmeasured realities that researchers believe significantly influence observed outcomes.
Example: Consider the concept of political ideology. Direct measurement is not possible; however, a researcher can assess it indirectly through questions such as:
- “Should wealth redistribution be enforced?”
- “Do you support the influence of trade unions?”
- “Is economic inequality justified?”
By aggregating responses to such questions, researchers infer the presence and intensity of the latent political ideology.
2. Factor Analysis (The Measurement Model)
Factor analysis serves as a critical component within SEM, often called the “measurement model.” It identifies latent variables by statistically grouping observable indicators, determining whether these indicators effectively measure the intended latent construct.
Example: If a researcher wants to evaluate job satisfaction, they might include indicators such as:
- Satisfaction with pay and benefits
- Relationship quality with coworkers
- Opportunities for career advancement
- Work-life balance
Factor analysis statistically combines these indicators to measure the underlying latent construct of job satisfaction.
3. Path Analysis (The Structural Model)
Path analysis, or the “structural model,” is a systematic method of examining causal or predictive relationships between different variables. It utilizes multiple simultaneous regression equations to test theoretical relationships comprehensively.
Example: Imagine a scenario where researchers want to understand how family socioeconomic status impacts educational attainment, which subsequently influences career choice, eventually affecting overall life satisfaction. SEM allows researchers to investigate these interconnected relationships simultaneously, providing a more comprehensive understanding than analyzing each relationship independently.
Key Terms: Endogenous vs. Exogenous Variables
- Endogenous Variables: These are variables within the model predicted by other variables. They depend on relationships with other variables in the model.
- Exogenous Variables: These are independent variables not influenced by other variables in the model. They are external inputs or initial causes.
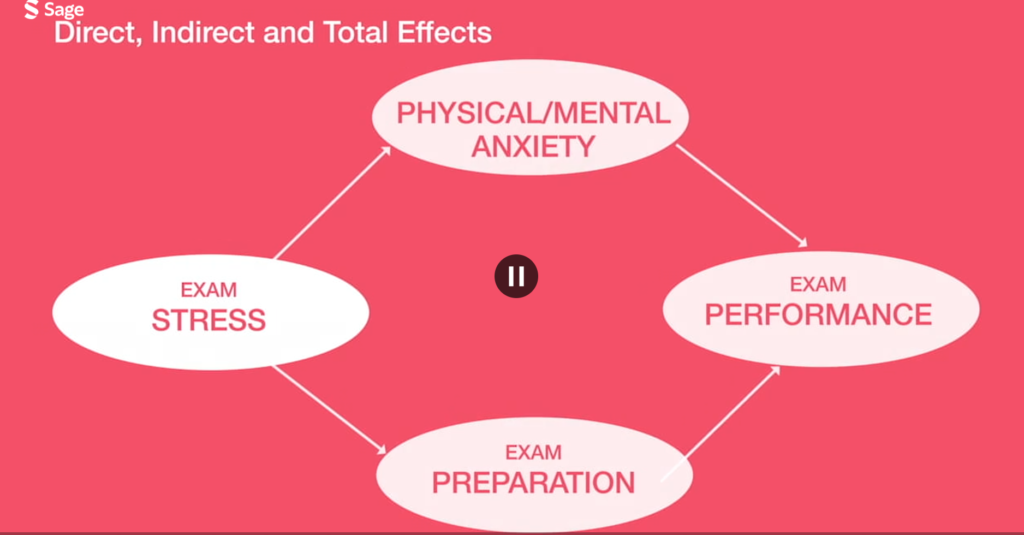
Example (Exam Performance Study):
- Exogenous Variable: Exam Stress (not influenced by any other variable in the study).
- Endogenous Variables: Exam Preparation, Anxiety, and Exam Performance (each influenced directly or indirectly by Exam Stress).
How SEM Works: Combining Measurement and Structural Models
SEM integrates the measurement and structural models. Initially, the measurement model (factor analysis) identifies latent variables through observed indicators. Subsequently, the structural model (path analysis) maps the relationships between these latent variables.
Example:
To analyze exam performance:
- Measurement Model:
- Exam Stress: measured through indicators like worry about failing, concern about future career impacts, frequency of intrusive thoughts about exams.
- Exam Preparation: indicators include hours of study per day, number of revision books read, participation in study groups.
- Anxiety: measured by physical and psychological symptoms, such as sleep disruptions, elevated heart rate, restlessness.
- Structural Model:
- Exam Stress influences Exam Preparation positively, enhancing performance.
- Exam Stress influences Anxiety negatively, impairing performance.
This combined approach elucidates both direct and indirect pathways of influence.
Interpreting SEM Results: Regression Coefficients and Model Fit
Every arrow (path) in an SEM diagram indicates a regression coefficient, which quantifies the relationship’s strength and direction between variables.
- Positive Coefficient: Indicates an increase in one variable is associated with an increase in another.
- Negative Coefficient: Indicates an increase in one variable results in a decrease in another.
Model Fit:
Evaluating model fit involves comparing the actual observed covariance matrix (the actual relationships in the data) against the model-implied covariance matrix (predicted relationships according to the theoretical model).
Fit Indicators Include:
- Exact Fit Measures: Chi-square test assesses precise fit.
- Approximate Fit Indices: Root Mean Square Error of Approximation (RMSEA), Comparative Fit Index (CFI), Tucker-Lewis Index (TLI), which provide broader, more flexible assessments of fit.
Practical Example of Results Interpretation:
Exam Performance SEM Results:
- Exam Stress → Exam Preparation: Positive coefficient (higher stress leads to increased preparation).
- Exam Stress → Anxiety: Positive coefficient (higher stress increases anxiety).
- Anxiety → Exam Performance: Negative coefficient (greater anxiety negatively impacts performance).
- Preparation → Exam Performance: Positive coefficient (better preparation improves performance).
Interestingly, the direct impact of Exam Stress on Exam Performance may be insignificant. Instead, stress impacts performance indirectly by simultaneously increasing preparation (positively) and anxiety (negatively), demonstrating SEM’s strength in clarifying nuanced indirect relationships.
Advanced SEM Applications
Beyond basic relationships, SEM is versatile in exploring complex scenarios, including:
- Mediation Analysis: Mediation analysis explores indirect relationships between variables by introducing a mediator, a variable through which the effect of an independent variable influences a dependent variable. It allows researchers to understand how or why an effect occurs. For example, in studying the relationship between job stress (independent variable) and job performance (dependent variable), job satisfaction could serve as a mediator. Increased job stress might lead to decreased job satisfaction, which in turn lowers job performance. Mediation analysis clarifies these indirect paths, revealing the underlying mechanisms of observed relationships.
- Moderation Analysis: Moderation analysis investigates how certain variables, called moderators, alter the strength or direction of the relationship between two other variables. It helps researchers understand under what conditions or for which groups a specific relationship holds true, weakens, strengthens, or even reverses direction. For instance, the effect of stress on performance might depend on the moderator variable “social support.” High social support could weaken or buffer the negative impact of stress, whereas low social support might amplify it. Thus, moderation analysis reveals conditional relationships and highlights nuanced contexts influencing outcomes.
- Longitudinal SEM: Longitudinal Structural Equation Modeling involves analyzing data collected from the same subjects repeatedly over different time points. This approach helps researchers examine how relationships among variables evolve, persist, or change across periods. Longitudinal SEM can track developmental trajectories, patterns of growth, stability, or decline, and can identify causal sequences over extended durations. For example, researchers might use longitudinal SEM to study how students’ academic motivation and performance change from freshman to senior year, identifying key predictors of growth and factors that may lead to improved or declining outcomes over the educational timeline.
Conclusion
SEM is an immensely powerful analytical framework capable of dissecting complex relationships involving observed and latent variables. Its integrative nature, combining measurement and structural components, makes it invaluable for rigorous theoretical testing and nuanced interpretation. Whether analyzing psychological states, socio-economic outcomes, educational achievements, or broader social phenomena, SEM provides clarity, precision, and comprehensive insight, elevating research quality across diverse disciplines.


Leave a Reply